|
Detailing the Variables Section |
  
|
Detailing the Variables Section
|
Detailing the Variables Section |
|
Overview
The Variables section handles the variables contained in the project being analyzed in the MCL-Tracer session. It allows you to view all the variables that are used in the project and to identify which are being used during a specific time within the project's flow and the values/information they store. This information is provided by the Execution Flow section (located to the left).
This section consists of two areas:
•The tab area which is divided into tabs - one tab per variable type (Global, Program, Local and System) and an "Auto" tab (displaying the variable(s) present in the row you selected in the Execution Flow section).
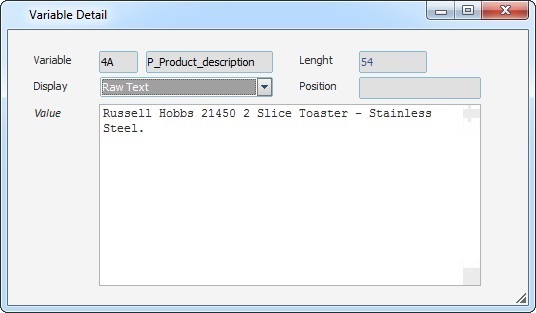
•The preview area which displays detailed information on the variable you selected in the tab area. These details can be viewed in the "preview box" or you can use ![]() to the open a floating window with those details.
to the open a floating window with those details.
The Variables section
The Tab area is organized into tabs and each tab consists of four columns. The information displayed in the Preview tab depends on what you have selected in the Tab area.
Tab area |
|||||
Auto tab |
Displays the variables, regardless of type, that are currently used in the execution row that is selected in the Execution Flow section. |
||||
Global tab |
Displays the Global type variables that exist in the project being analyzed. |
||||
Program tab |
Displays the Program type variables that exist in the project being analyzed. |
||||
Local tab |
Displays the Local type variables that exist in the project being analyzed. |
||||
System tab |
Displays the System type variables that exist in the project being analyzed. |
||||
Columns for each tab |
|||||
Id column |
Provides the variable's Id. |
||||
Name column |
Displays the name of the variable. |
||||
Value column |
Displays the variable's value. |
||||
Length column |
Informs you of the stored string's length. |
||||
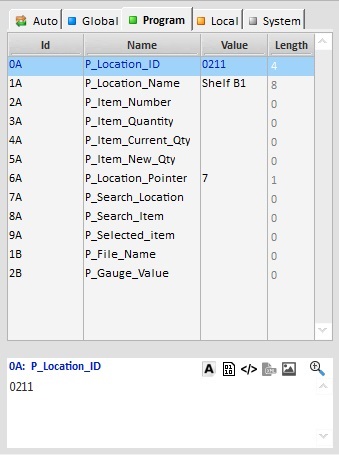
Preview area |
|||||
Its content depends on the variable you have selected in the Tab area. It displays the selected variable's details (ID, name and current value) regardless of the variable type/open tab.
•If required, use the following buttons or right-click anywhere in the Preview area and select the desired option to view the variable's value in other formats. The viewing of a value in another format will depend on the variable's original value and if it is convertible to that other format or not.
</> HTML format
•If required, use the
|
|||||
The Variables Section's Color Code
The Variables section uses color to identify the purpose of the displayed variables and if they are being used in real time. The displayed variables always refer to the row selected in the Execution Flow section.
Black - The variable is defined in the project but is not in use by the control/process referenced in the selected row.
Red - the variable was written, meaning, it accepted data for storage.
Blue - the variable was read, meaning, its content was used in the control/process.
This is an example of what can be viewed in each tab when the same row is selected in the Execution Flow table:
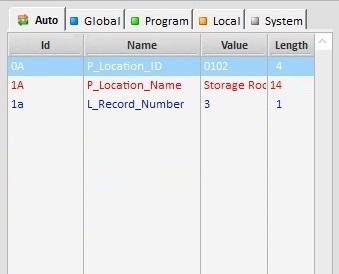
Auto tab |
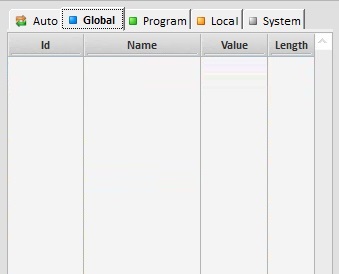
Global tab |
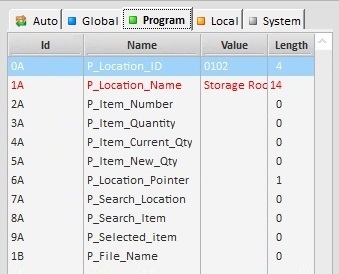
Program tab |
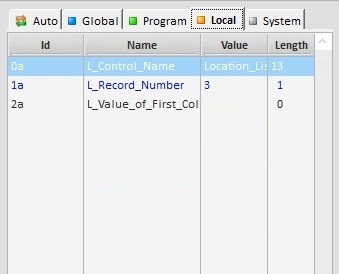
Local tab |
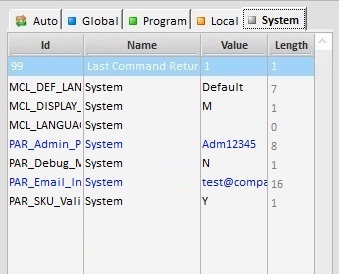
System tab |
|
|
|
|
|
Contains the variables in use, regardless of type, in the selected row in the Execution Flow section. The variable in red accepted data, the one in blue was read. |
Empty, because the project being analyzed does not contain any global variables. |
Displays all the program variables contained in the project. If a variable has a different color, it means that it is being used in the selected row. Since, in this case, there is a variable in red, that means that data was written into it. |
Displays all the local variables contained in the event. If a variable has a different color, it means that it is being used in the selected row. In this case, there is a variable in blue, meaning, the content of this variable was read. |
Displays the system variables and the app param variables contained in the project. Only 2 app param variables (in blue) have had their content read. |
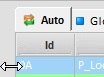
It is possible to control the width of a column and sort the displayed information:
•Column Width
Use the drag-and-drop to enlarge or reduce a column or the area of the Variables section itself.
1. Mouse over the border of the column or the area.
2. When the cursor changes to a "double-arrow", drag the cursor into the intended direction to enlarge/reduce that column/area.
![]()
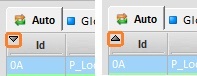
•Column Sorting
Use the ![]() (located on each column's left upper corner) to sort the displayed variables in an ascending or descending order, as required:
(located on each column's left upper corner) to sort the displayed variables in an ascending or descending order, as required: