|
MCL-Tracer |
  
|
MCL-Tracer
|
MCL-Tracer |
|
Overview
MCL-Tracer is a useful tool for project flow analysis and debugging. It can be launched from MCL-Designer (ex: the project is run within MCL-Simulator) or it can stand alone (ex: the project is uploaded and run within a device).
This tool displays the application's flow, in real time and exposes the visible elements (screens, controls) as well as the background elements involved (processes, events, associated variables, etc. ). MCL-Tracer requires an MCL-Client (runtime) with a running project, so, you must either run it through a simulator or load it into a device and use the project.
To Access MCL-Tracer
MCL-Tracer can be used within MCL-Designer V4, to test a project or you can use it to analyze a project that has been loaded into a device.
•Use one of the following to open MCL-Tracer within MCL-Designer V4:
a. In the Menu Bar, click "Project" and, then, the "MCL-Tracer" option.
b. Use the "Shift+F7" keyboard keys.
c. Click the "Shift" keyboard key and right-click ![]() (located in the Icon Shortcut bar.
(located in the Icon Shortcut bar.
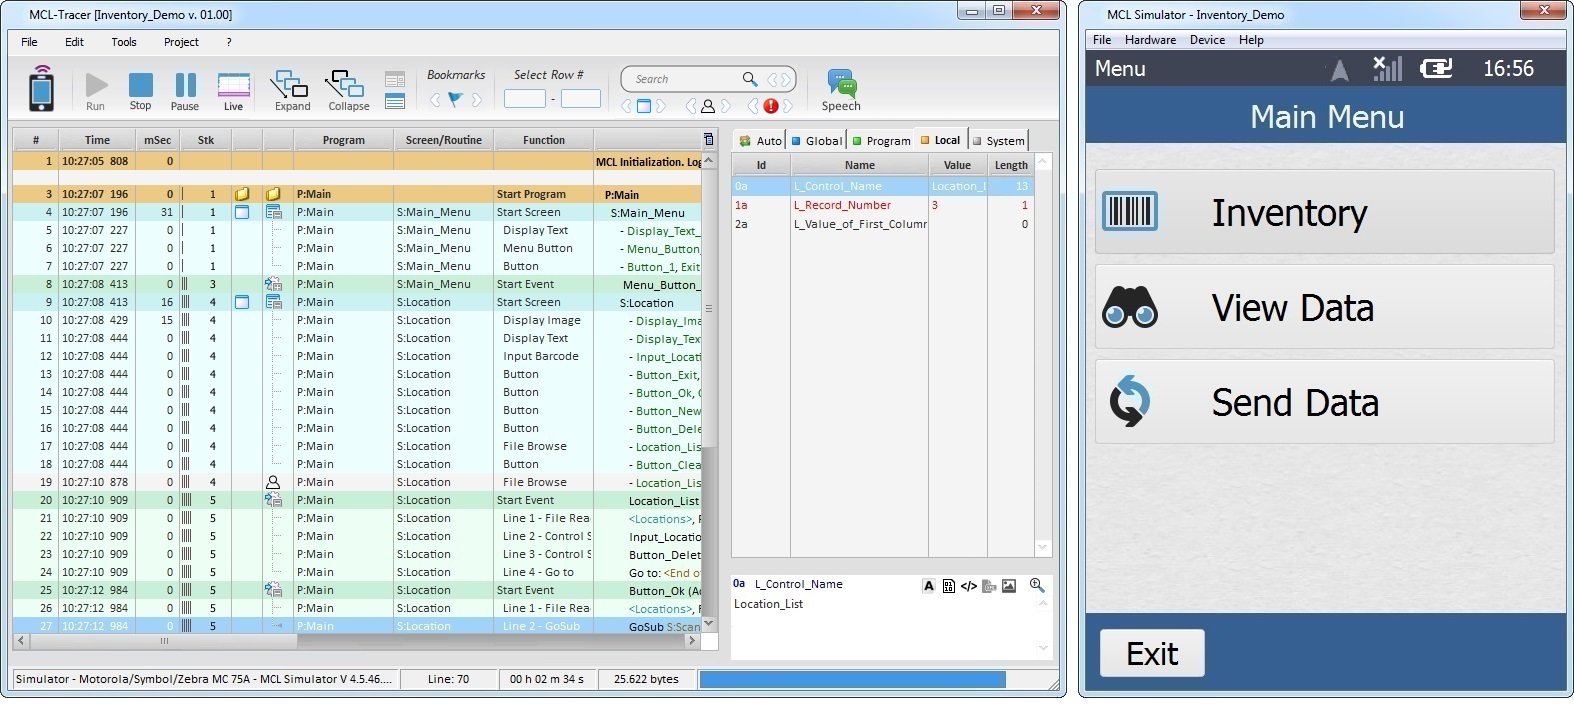
Whatever the selected option, both the MCL-Simulator and the MCL-Tracer are launched displaying the currently open project. (You can only use the MCL-Simulator and the MCL-Tracer tools if there is an open project).
•If you intend to analyze a project that is running in a device, you must call MCL-Tracer from the MCL-Designer V4 installation folder (default is \MCL4\Designer\Bin) by executing the "MCL-Tracer.exe" file.
Before executing MCL-Tracer, make sure the intended project is open and running in the device. This procedure does not launch MCL-Simulator.
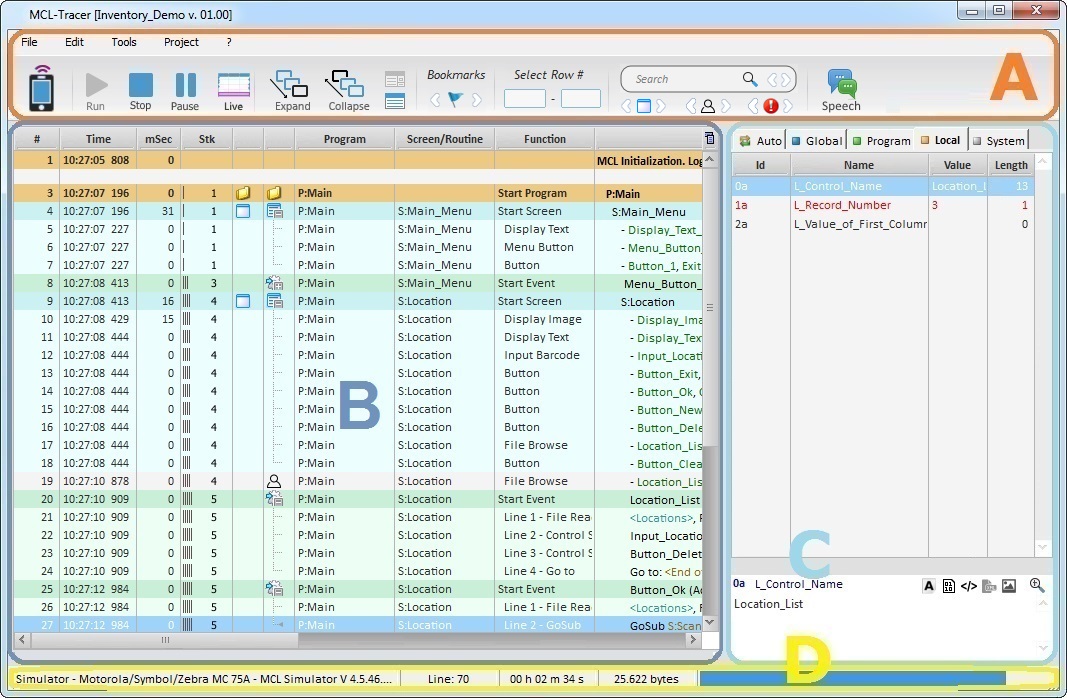
MCL-Tracer Work Area
The image below indicates the 4 main sections of MCL-Tracer.
A – Menu Bar Section
D – Status Section
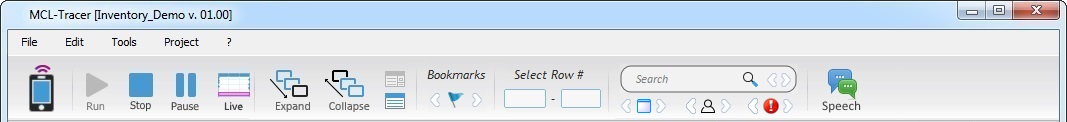
The Menu Bar Section contains the following:
An Options bar - consists of a series of drop-down menus that provide access to common functions such as opening projects or Help. See Detailing the Options Bar.
An Icons bar - includes graphical representations of commonly used project analysis functions. See Detailing the Icons Bar
A Search tool - Is used to search a particular string (ex: variable value/name, screen or control name) in the Execution Flow Section.
Navigation Buttons - are used to navigate the Execution Flow Section after a search( the starting point is the selected row/search result).
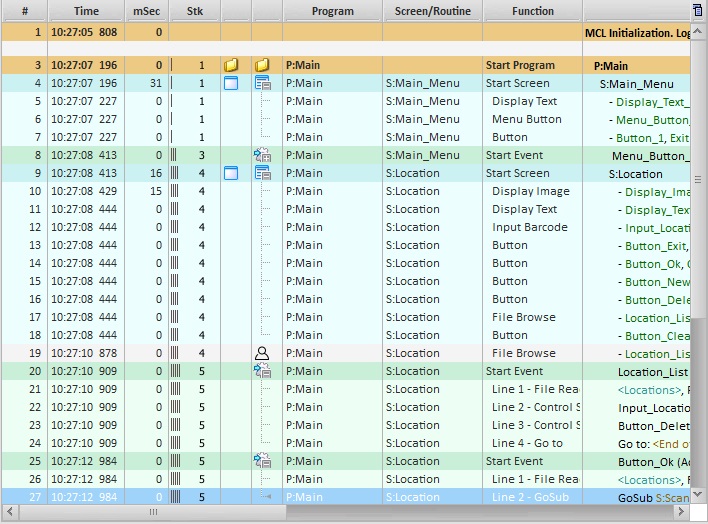
By default, the Execution Flow Section displays the background flow of a running project in real time. The available logical elements (ex: running programs, screens, controls, events, processes, etc.) are organized into a table.
See Detailing the Execution Flow Section.
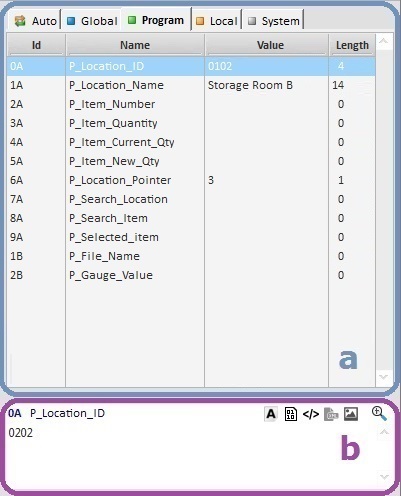
The Variables Section displays the variables being used within the running project (Global, Program, Local and System) and the values they contain. This section is divided into 2 areas:
•The tab area (a) is organized into tabs (a tab per variable type + "Auto" tab).
•The preview area (b) displays more detailed information on the selected variable (in the top area).
See Detailing the Variables Section.
![]()
The Status Section is divided into four areas, giving the following information:
Ex: Simulator - Motorola/Zymbol/Zebra MC 75A - MCL Simulator V 4.4.56.9003 •The source for the running project: "MCL-Simulator" - if the project is running in the simulator. An IP - if the project is running in a device. The name of the log file - if you are analyzing an MCL-Tracer Log File (an automatically generated file for each MCL-Tracer session). •The target device manufacturer and model. •Depending on the source, refers to the SW version of the simulator or the device. |
Ex: Line: 47 Selected execution row. |
Ex: 00 h 00m 11 s Execution time of the current project. |
Ex: 16.206 bytes The size of the MCL-Tracer Log File.
MCL-Tracer Log File a file which is automatically generated every time you open an MCL-Tracer session and is stored in the current project's "Tracer" folder. |
Pregression bar An interactive progression bar representing the project's execution flow. It can be used to navigate the project's execution flow section. It can be useful in an execution flow with a lot of lines because it is faster than using the vertical elevator (in the Execution Flow Section). |