|
Detailing the Execution Flow Section |
  
|
Detailing the Execution Flow Section
|
Detailing the Execution Flow Section |
|
Overview
The Execution Flow section consists of a table that displays the flow of a project, in real time.
This flow is represented by execution rows that contain information to be viewed,analyzed and fed into the "Variables" section.
You can copy/paste rows, however, the information contained in the rows of the Execution Flow section is NOT editable.
The Execution Flow section
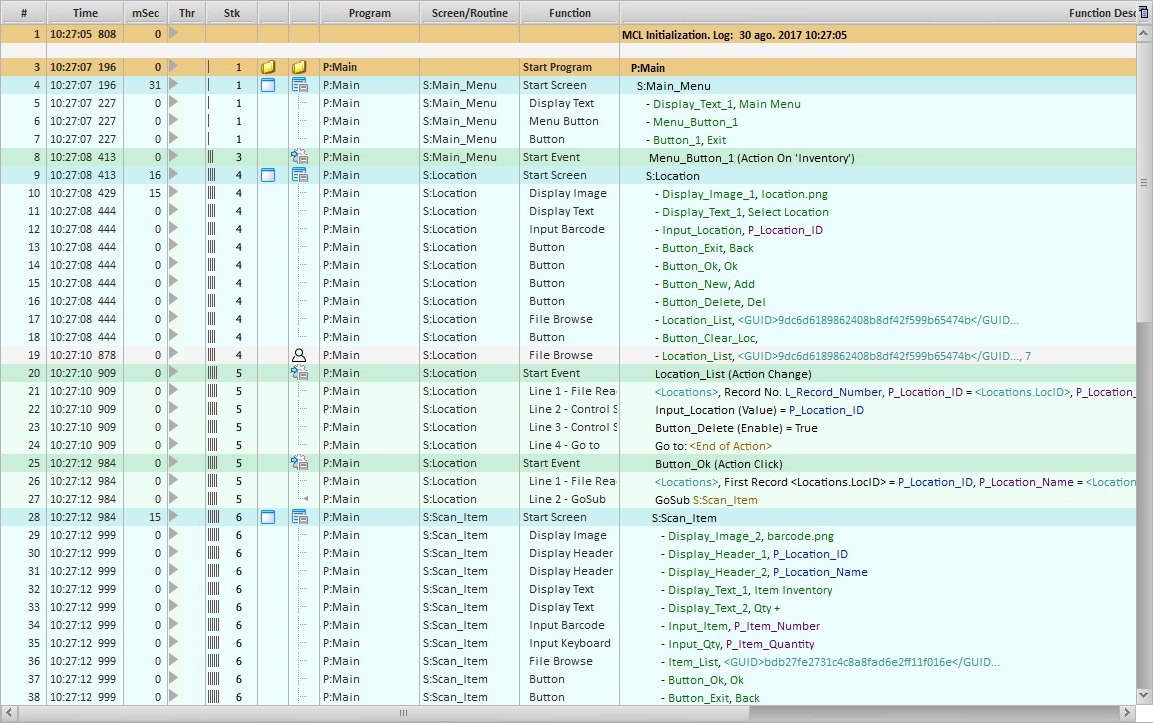
Execution Flow Table |
|
First row |
Displays the start date/time of the session's log file. |
# column |
Number of the execution row and Bookmarks |
Time column |
When each row is executed. |
mSec column |
Elapsed time between two processes. |
Thr column |
N/A |
Stk column |
Program "stack" level. |
Screen column |
Graphic representation of a screen - |
Icons column |
Graphic representation of the element where the actions are being executed. |
Program column |
The name of the program (within the project) where the actions are being executed. |
Screen/Routine column |
The name of the screen or routine where the actions are being executed. |
Event column |
The name of the event associated to the action being executed. |
Function column |
The name of the element being executed (ex: the control, the process). |
Function Description column |
Element detail(s) and parameter(s) associated to the action being executed (referred in the "Function" column). |
Below are the icons that can be displayed in the "Icons column" of the "Execution Flow" table that represent a project element.
|
Represents a Program. |
|
Represents a Global Procedure. |
|
Represents a Global Event. |
|
Refers to a Screen with expanded content (its execution rows are visible). |
|
Identifies to a Screen with collapsed content (its execution rows are concealed). |
|
Refers to a physical interaction between operator and project. |
|
Represents an Event with expanded content (its execution rows are visible). |
|
Refers to an Event with collapsed content (its execution rows are concealed). |
|
Represents a Routine with expanded content (its execution rows are visible). |
|
Represents a Routine with expanded content (its execution rows are concealed). |
|
Represents a Local Procedure with expanded content (its execution rows are visible). |
|
Represents a Local Procedure with expanded content (its execution rows are concealed). |
|
Identifies a GoSub, a Call or a Return line process. |
|
Identifies an Exit line process. |
|
N/A |
|
Identifies an Error occurred during the application flow (ex: a communications error). |
Available Menus
Although the information within the execution rows is NOT editable, it is possible to manage the viewed information (ex: copy/paste of rows, data export, data printing, etc).
The Execution Flow section provides several menus with options.
The ![]() Menu
Menu
The ![]() button is located on the upper right corner of the Execution Flow section and provides access to the following option:
button is located on the upper right corner of the Execution Flow section and provides access to the following option:
|
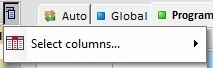
Select columns |
Use this option to define which columns should be displayed. See Column Display. |
The Right-Click Option of the Column Header
If you right-click a column header, the following option opens:
|
Select columns |
Use this option to define which columns should be displayed. See Column Display. |
The Right-Click Menu of a Row
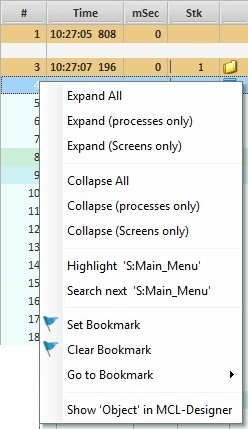
If you right-click a row, you access the following options:
|
Expand All |
Expands all collapsed/hidden rows (regardless of content) within the Execution Flow table. |
Expand (Processes Only) |
Expands the collapsed/hidden rows that relate to processes within the Execution Flow table. |
|
Expand (Screens Only) |
Expands the collapsed/hidden rows that relate to screens within the Execution Flow table. |
|
Collapse All |
Collapses/conceals all possible rows (regardless of content) within the Execution Flow table. |
|
Collapse (Processes Only) |
Collapses/conceals the rows that relate to processes within the Execution Flow table. |
|
Collapse (Screens Only) |
Collapses/conceals the rows that relate to screens within the Execution Flow table. |
|
Highlight 'xxxxxxxxxx' |
Searches and highlights all the occurrences of the selected string 'xxxxxx' in the Execution Flow section. The string refers to what was previously clicked/selected in the "Program", "Screen/Routine", "Function" or "Function Description" columns. Ex: Click "S:Main_Screen" in the "Screen/Routine" column and, then, select the "Highlight 'S:Main Street' "option - all the "S:Main_Screen" occurrences within the rows of the Execution Flow section will be highlighted.
To remove the highlighted strings, clear the search box located on the Icons Bar and click "<Enter>". |
|
Search next 'xxxxxxxxxx' |
Searches the next occurrence of the selected string 'xxxxxx' (ex: "S:Main_Screen"). This string is in the selected line in the Execution Flow table and only available if the right-click was in columns are Program, Screen/Routine, Function or Function Description. |
|
Set Bookmark |
Applies a bookmark to the selected row. |
|
Clear Bookmark |
Clears the selected row's bookmark. This options is only available if there is a bookmark in the selected row. |
|
Go to Bookmark |
Allows you to "jump" to another bookmark within the Execution Flow section. The "Previous", "Next" or "Last" options are calculated based on the currently selected row's position. |
|
Show 'Object' in MCL-Designer |
Opens the properties window within MCL-Designer V4 of the element included in the selected row. |
Execution Flow Table's Navigation/Display Control
Use the following to navigate the Execution Flow table and view further information on the execution rows:
•Scroll Bar Navigation
Use the horizontal and/or vertical scroll bars to navigate across the table.
As an alternative, use the slider (located in the Status section). This is a useful/faster option, if the MCL-Tracer session comprehends hundreds of rows.
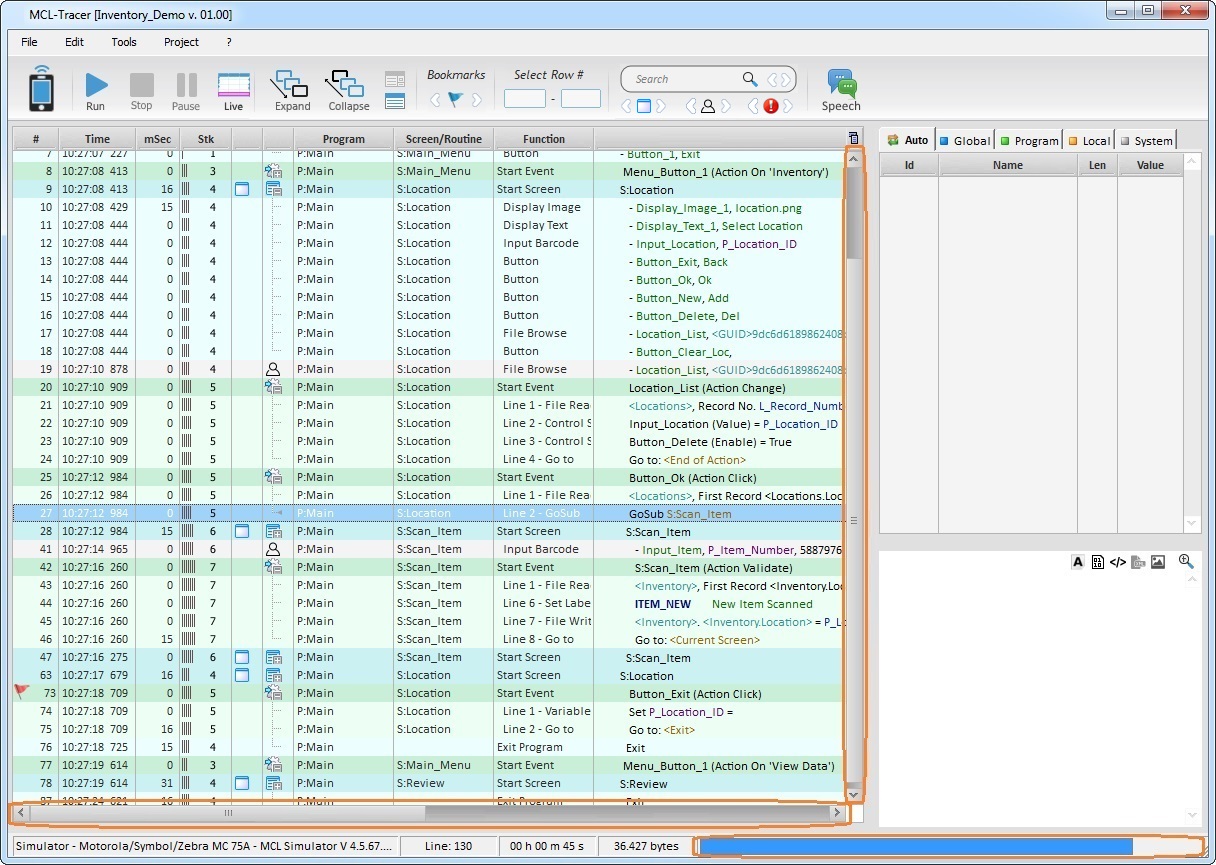
•Mouse Over for Information
If you place your mouse over a variable in the "Function Description" column, a pop-up balloon with real time info on the variable is presented. It includes the variable's ID; name and value at that execution time.
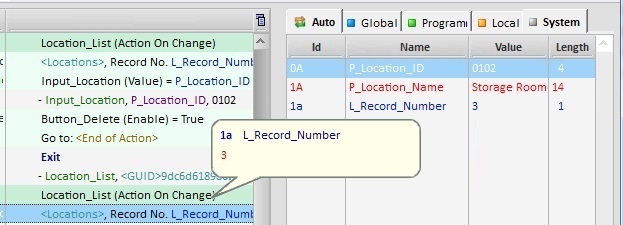
![]() If you want to view the corresponding information on the tabs of the Variables section (area to the right), you must click the variable.
If you want to view the corresponding information on the tabs of the Variables section (area to the right), you must click the variable.
It is possible to control the display of the Execution Flow table, meaning, you can define which columns should be displayed and their width:

Use one of the following options to ensure the viewing of a column:
a. Use the ![]() button (located on the Execution Flow table's upper right corner).
button (located on the Execution Flow table's upper right corner).
I. Click ![]() to open a menu.
to open a menu.
II. Mouse over ![]() to open a list with all the table's columns.
to open a list with all the table's columns.
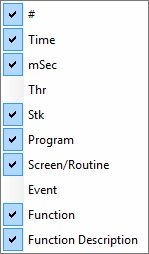
III. Check the columns you want exposed.
b. Use the right-click menu:
I. Right-click a column header to access the corresponding menu.
II. Mouse over the ![]() option to access a list with all the table's columns.
option to access a list with all the table's columns.
III. Check the columns you want exposed.
•Column Width
Use the drag-a-drop to enlarge or reduce a column or the Execution Flow table itself.
1. Mouse over the border of the column or the table.
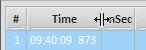
2. When the cursor changes to a "double-arrow", drag the cursor into the intended direction to enlarge/reduce that area.