|
Detailing the Icons Bar |
  
|
Detailing the Icons Bar
|
Detailing the Icons Bar |
|
Overview
The Icons Bar displays shortcut icons for some of the most common MCL-Tracer commands (which, with the exception of the Speech option, are also available in the Options bar).
 Is used to define the project you want to analyze and the source for its data. It opens a window you must fill in as follows:
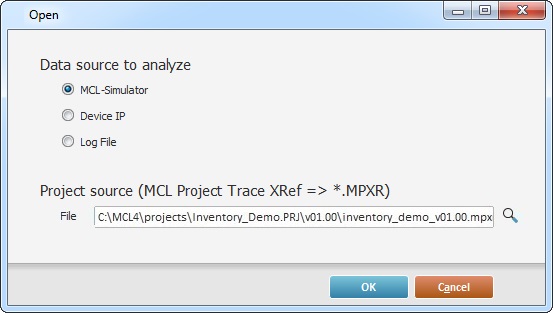
a. Select the source for the project's information:
•MCL-Simulator - (default option) Check this option, if you want to analyze a project that is running in the MCL-Simulator.
•Device IP - If you want to analyze a project running in a device, check this option. In this case, a new option ("IP") becomes visible so you can enter that device's IP.
![]() When checking the "Device IP" option, consider the following:
When checking the "Device IP" option, consider the following:
If you intend to use a a Windows CE device with a USB connection, the connection must be configured in RNDIS mode. If this is not possible (option NOT available in the Windows CE device or the Windows Mobile Device Center), you must use a valid IP, meaning, an IP from an Ethernet or Wireless connection to ensure a successful connection to MCL-Tracer.
![]()
Make sure the device includes the project you defined as project source ("File" option).
•Log File - Check this option to analyze a project's log file. Use ![]() to open the intended project's folder and locate it.
to open the intended project's folder and locate it.
b. Select the project you intend to analyze. Click ![]() to browse for the intended project's .mprx file (located in the project's folder).
to browse for the intended project's .mprx file (located in the project's folder).
( .mpxr file - this file is created when you generate the MCL application.)
![]()
MCL-Tracer uses an .mpxr file. This file is only created when you generate the MCL application within MCL-Designer V4. Use one of the following, to trigger the creation of your project's .mpxr file :
a. Perform a direct "generate" operation. Click the "Generate" icon (in the Icon Shortcut Bar) OR click the "Generate" option (located in the "Project" menu of the Menu Bar) OR use the corresponding <F6> shortcut key.
b. The launching of MCL-Simulator generates the MCL application. Click the "Simulate" icon (in the Icon Shortcut Bar) OR click the "Simulate" option (in the "Project" menu of the Menu Bar) OR use the corresponding <F7> shortcut key.
c. The loading of your project into a device also generates the MCL application. Click the "Load" icon (in the Icon Shortcut Bar) OR click the "Load to Device" option (in the "Project" menu of the Menu Bar) OR use the corresponding <F8> shortcut key.
c. Click ![]() to apply or
to apply or ![]() to abort the operation.
to abort the operation.
This icon has two states:
|
This icon state represents a paused or stopped MCL-Tracer session. |
|
These intermittent icons correspond to an MCL-Tracer session that is currently running. |
 Is used to initiate/resume an MCL-Tracer session (and generate the corresponding log file).
If the MCL-Tracer session was put on stand by, clicking it will resume the current session/log file.
If you click it after having used the "Stop" command, a new session/log file is opened (the "Execution Flow" section is emptied of any previous information).
 Is used to end the current MCL-Tracer session (and close the corresponding log file).
 Is used to set the current running MCL-Tracer session on stand by.
If you run MCL-Tracer again, the session and the writing into the log file will resume.
 The Live mode forces the last executed row's selection, meaning, if you activate it, the focus will go to the last row of the "Execution Flow" section, which is running in real time.
Ex: The Live mode is selected, forcing the selection of the last executed row. In the meantime, you select a different row. As soon as another row is generated (because the application resumes), the focus goes back to the last row.
By default, this option is inactive which means your selection of a particular row will be maintained despite there being new execution rows.
Check the displayed icon to know if the Live mode is active or not.
Live mode Inactive (default option) |
Live mode Active |
|
|
To revert to an inactive Live mode, click ![]()
![]()
Depending on your row selection control of the Execution Flow section (inactive/active Live mode), it will affect the Variables section:
without a Live mode - the displayed variables/values refer to the selected row.
with Active Live mode - the displayed variables/values refer to the selected row. Note that the Variables section will mostly display the variables/values that refer to the last row, since this mode "forces" the selection of the last row being executed in the "Execution Flow" section.
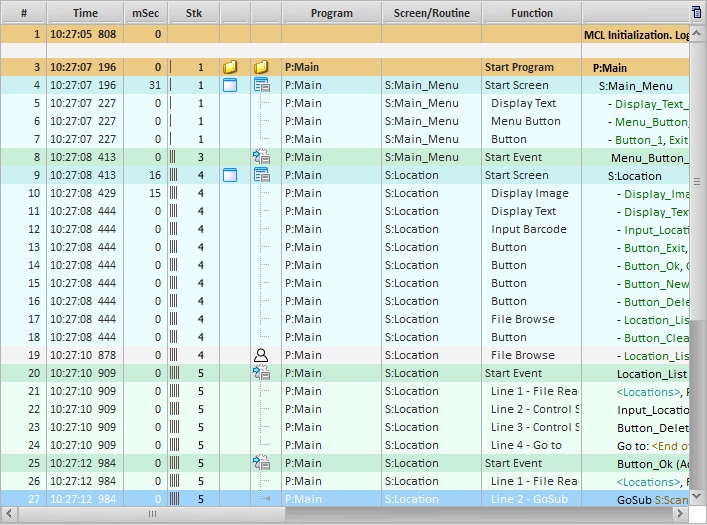
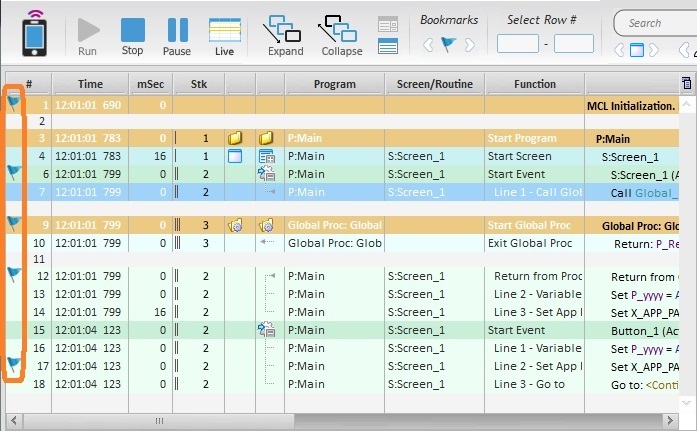
 Is used to open any closed/grouped execution rows within the "Execution Flow" section.
If a screen includes collapsed rows it is identified with a ![]() . Events with collapsed rows are marked with a
. Events with collapsed rows are marked with a ![]() .
.
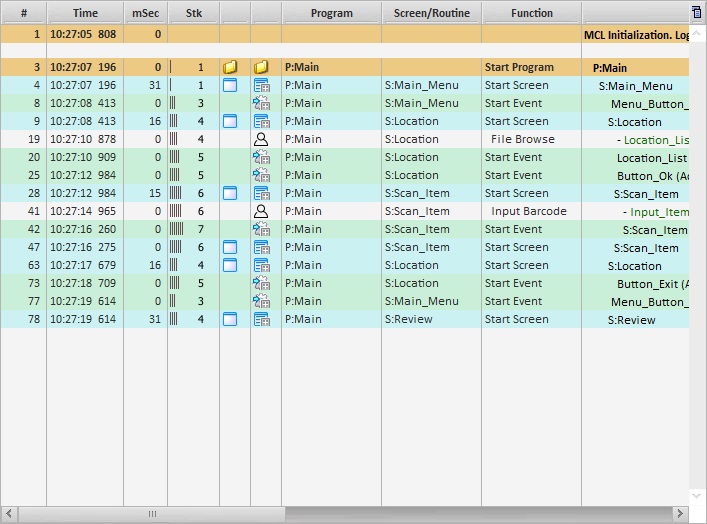
 Is used to hide/group execution rows within each screen and event. The screens/events without collapsed rows (a full display) are identified by the corresponding
 ![]() /
/![]() .
.
![]() Both options ("Expand" and "Collapse") affect all the rows of the "Execution Flow" section.
Both options ("Expand" and "Collapse") affect all the rows of the "Execution Flow" section.
A full view with the use of the "Expand"option |
A collapsed view with the use of the "Collapse" option |
|
|
Show/Hide Variables Section icons
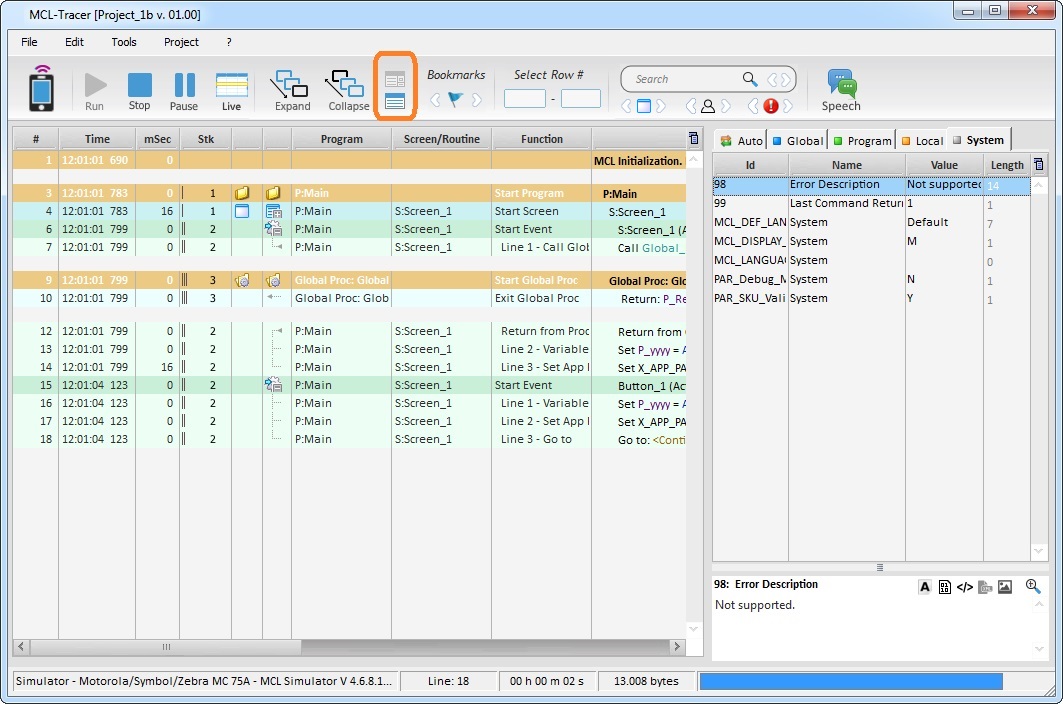
![]() Is used to show the "Execution Flow" section and the "Variables" section.
Is used to show the "Execution Flow" section and the "Variables" section.
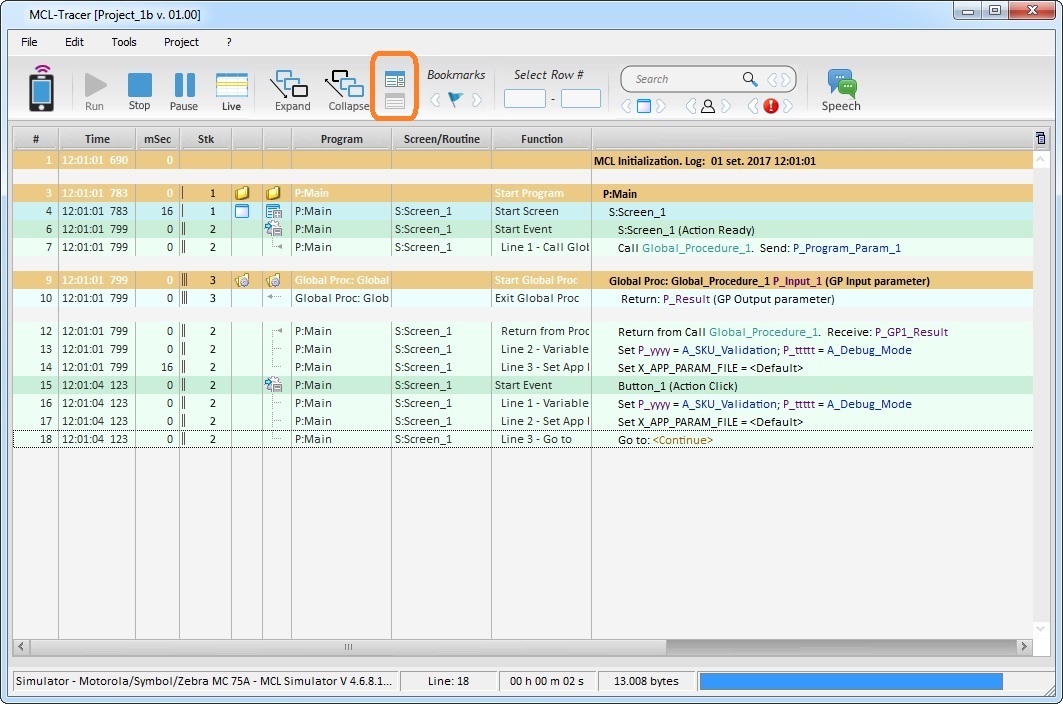
![]() Is used to hide the "Variables" section.
Is used to hide the "Variables" section.
A full view with the use of the Show Variables Section option |
A full view with the use of the Hide Variables Section option |
|
|
![]() Is used to create bookmarks (or "points of interest") in the application's execution flow that you can "jump" to.
Is used to create bookmarks (or "points of interest") in the application's execution flow that you can "jump" to.
Navigate between Bookmarks |
|
|
Click the central "flag" to define a bookmark in the selected row of the execution flow. See Setting a Bookmark. |
|
Click the arrow to the left to navigate to the previous bookmark. |
|
Click the arrow to the right to navigate to the next bookmark. |
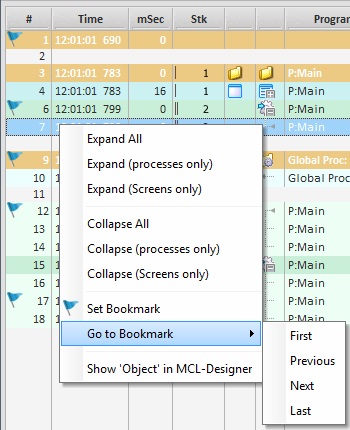
![]() You can also "jump" to the desired bookmark by right-clicking anywhere in the Execution Flow section, selecting "Go To Bookmark" and, then, selecting "First", "Previous", "Next" or "Last" ("Previous", "Next" or "Last" positions relate to the currently selected row).
You can also "jump" to the desired bookmark by right-clicking anywhere in the Execution Flow section, selecting "Go To Bookmark" and, then, selecting "First", "Previous", "Next" or "Last" ("Previous", "Next" or "Last" positions relate to the currently selected row).
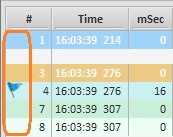
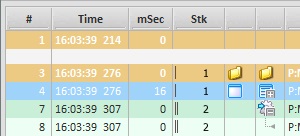
Example of Bookmarks
|
This example includes 5 Bookmarks placed in rows 1, 6, 9, 12 and 17.
|
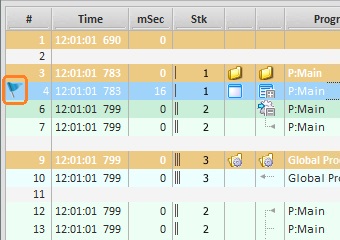
Use one of the following to place a bookmark:
•Click to the left of the intended row's row number.
•Select the row you want to add a bookmark to and, then, click ![]() in the Icons Bar section.
in the Icons Bar section.
•Use the "right-click menu" available In the Execution Flow section:
1. Right-click the row you want to add a bookmark to.
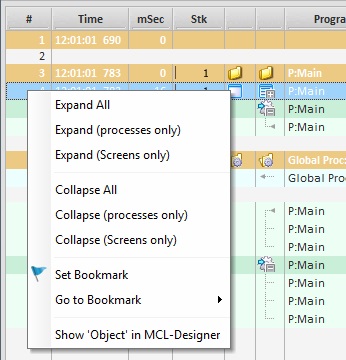
2. In the resulting menu, select "Set Bookmark".
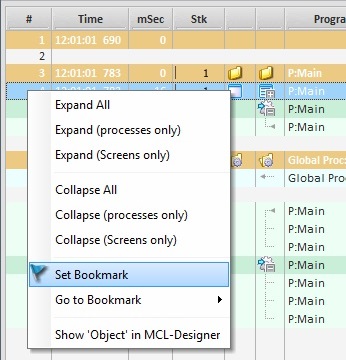
The bookmark is placed in the selected row (to the left of the row number).
•Use the ![]() menu:
menu:
1. Select the row you want to add a bookmark to.
2. Click ![]() (located on the Execution Flow section's upper right corner) to open the corresponding menu.
(located on the Execution Flow section's upper right corner) to open the corresponding menu.
3. Select the "Set Bookmark" option.
Use one of the following to remove a bookmark from the Execution Flow section:
•Click the bookmark ![]() you want to remove.
you want to remove.
•Select the row with the bookmark you want to clear and, then, click ![]() in the Icons Bar section.
in the Icons Bar section.
•Use the "right-click menu" available In the Execution Flow section:
1. Right-click the row with the bookmark you want to remove.
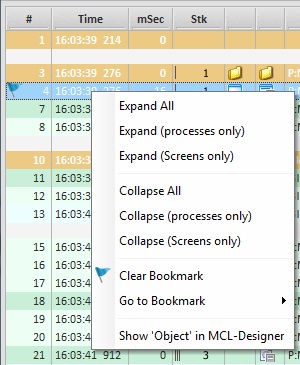
2. In the resulting menu, select "Clear Bookmark".
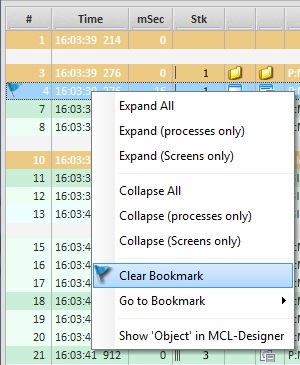
The bookmark is removed from the selected row.
•Use the ![]() menu:
menu:
1. Select the row you want to clear the bookmark from.
2. Click ![]() (located on the Execution Flow section's upper right corner) to open the corresponding menu.
(located on the Execution Flow section's upper right corner) to open the corresponding menu.
3. Select the "Clear Bookmark" option.
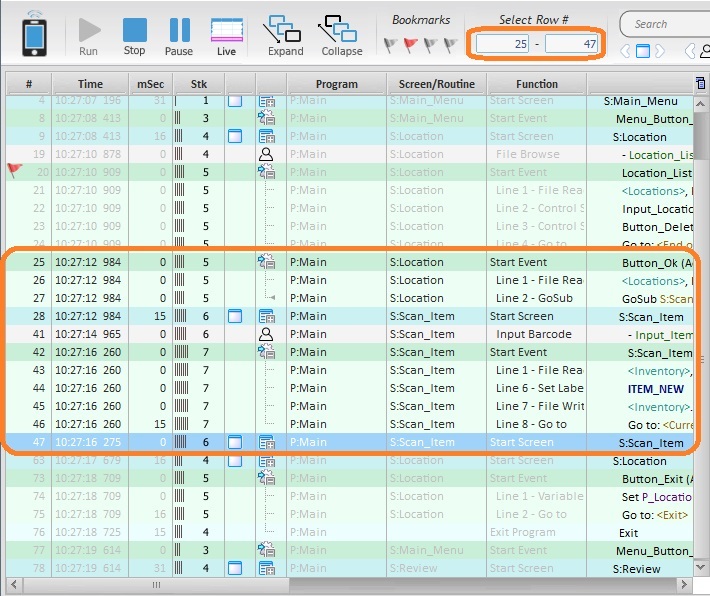
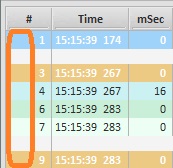
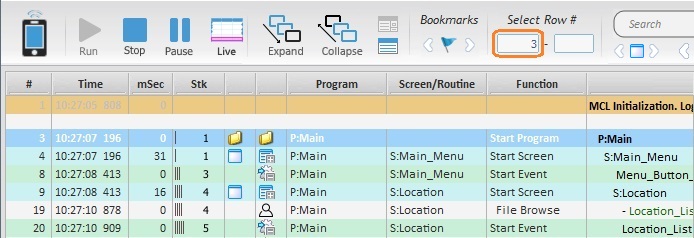
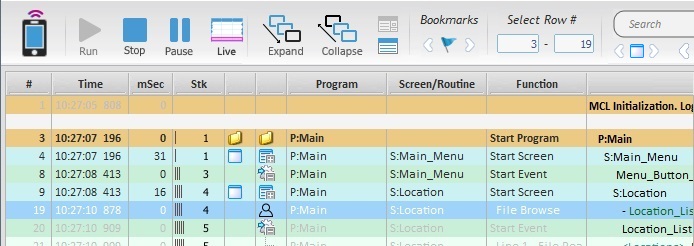
The Select Row # tool is used for analysis purposes - it highlights a particular set of execution rows by graying out all the others.
Example of Highlighted Rows with the Use of the Select Row # Tool
|
•Rows 25 to 47 have been selected in the "Select Row #" option (in the Icons Bar section) - the rows are visible.
•All other rows are grayed out. |
To Select Rows with "Select Row #"
Step-by-step
1. In the "Select Row #" option's left box, enter the row number that refers to the beginning of the selection (ex: 3).
2. Press “<Enter>” in your PC keyboard.
3. In the "Select Row #" option's right box, enter the row number that refers to the end of the selection (ex: 19).
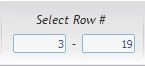
4. Press “<Enter>” in your PC keyboard.
Every row in the Execution Flow section is now grayed out except for rows 3 to 19.
To Clear the "Select Row #" Selection
To deselect the rows, simply clear the "Select Rows #" boxes and press "<Enter>" in your PC keyboard to apply.
Search tool/Navigation buttons
General Search |
|
|
Is used to search a particular string (variable value/name, screen or control name) in the Execution Flow section. |
|
(Previous/Next) Only available within a search context. Use these buttons to go to the previous row or the next row with the searched string. The starting point is the initial row with the matched string. |
Navigate between Screens |
|
|
Use this button to navigate to the 1st screen. |
|
Use this button to navigate to the previous screen. |
|
Use this button to navigate to the next screen. |
Navigate between Operator Inputs |
|
|
Use this button to navigate to the 1st operator input. |
|
Use this button to navigate to the previous operator input. |
|
Use this button to navigate to the next operator input. |
Navigate between Errors |
|
|
Use this button to navigate to the 1st "Last Command Return Code" with value "1" (system variable 99=1). |
|
Use this button to navigate to the previous "Last Command Return Code" with value "1" (system variable 99=1). |
|
Use this button to navigate to the next "Last Command Return Code" with value "1" (system variable 99=1). |
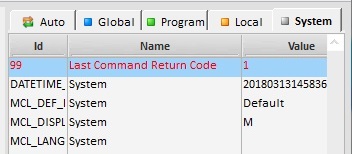
Example of a "Last Command Return Code = 1" error
|
This window refers to the "System" tab which is displaying a specific error:
A "Last Command Return Code" error has occurred related to the system variable with the ID "99" and that contains "1" as a value. |
 Is used to open a window containing the operator's "speech dialogs".
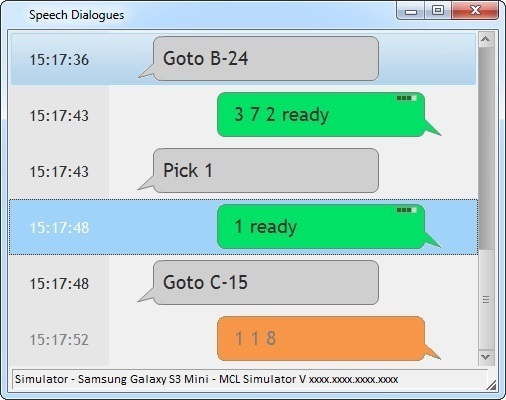
Example of a speech dialog
|
This window includes the following information:
•The speech input (what the operator says) and output (what the operator hears) that occurred within the project. Use the following to identify/understand the input/output info: ✓The pointer of the dialog balloon indicates the output and the input speeches - pointer to the left refers to output speech and pointer to the right represents input speech. ✓The color gray is associated to output speech. ✓The color green represents an acceptable/recognizable speech input. ✓The color orange refers to a rejected speech input. ✓The icon on the dialog balloon's upper right corner displays the confidence level of the input speech.
•The timestamp for each speech input/output.
•The source for the displayed information: "Simulator" - if the project is running in the "MCL-Simulator". Device IP - if the project is running in a device. Log file name - if you are running a log file.
•The model of the project's target device.
•The source's SW version The MCL-Simulator's version The device's MCL-Client version Not applicable when using a log file. |