|
Report View |
  
|
Report View
|
Report View |
|
Overview
A Report provides specific information on your site's entities - devices, operator groups, device groups, etc.
Access the available reports to check for relevant data and, if necessary, to export it.
Report View Page
Access: Open the "Report Management" page (Site Dashboard > Control Panel > Business Analytics module > Reporting sub-module > Report Management page) and click the name of the intended report.
This page is divided into a Data section, which displays the report's returned data and a "Parameters" panel (hidden by default, to the left, that can be expanded to check/edit the parameters set for this report).
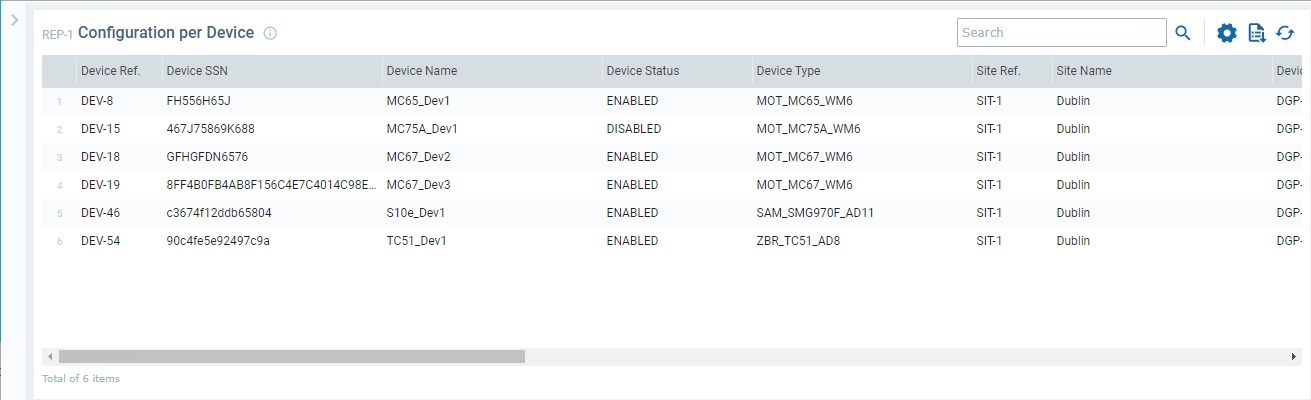
Example of the report view page of a report:
Ex: This report is meant to return a device's configuration related data so the table is made up of columns that convey that type of information ("Device Ref.", "Device SSN", "Device Name", "Device Status", "Device Type", "Site Ref.", etc.).
This section displays the data returned by the selected report which is aggregated according to its defined parameters (you can expand the "Parameters" section to check which parameters, if any, have been set for the current report).
![]()
•Use the search box to look for a specific item/element.
•![]() Opens a pop-up window where you can define which columns should be displayed in the table listing the reports.
Opens a pop-up window where you can define which columns should be displayed in the table listing the reports.
The listed columns depend on the report type/data it is meant to return.
Click ![]() again to hide the list.
again to hide the list.
•![]() Downloads a list with the reports.
Downloads a list with the reports.
The report list is downloaded in an Excel file format. ("MP_<report name>_<time stamp>.report.csv" file - ex. "MP_Devicelist config v1_211210112045.report.csv".)
![]() Since the export ONLY includes the information displayed in the Data section, make sure that this section contains the intended columns and check the parameters set in the "Parameters" panel before doing a report export because they can filter the data display.
Since the export ONLY includes the information displayed in the Data section, make sure that this section contains the intended columns and check the parameters set in the "Parameters" panel before doing a report export because they can filter the data display.
•![]() Refreshes the information on the current page.
Refreshes the information on the current page.
This panel is hidden by default - click ![]() (upper left corner) to expand it.
(upper left corner) to expand it.
This panel includes the parameters that are compatible with the current report.
Example of a report's Report View page with an expanded "Parameters" panel.
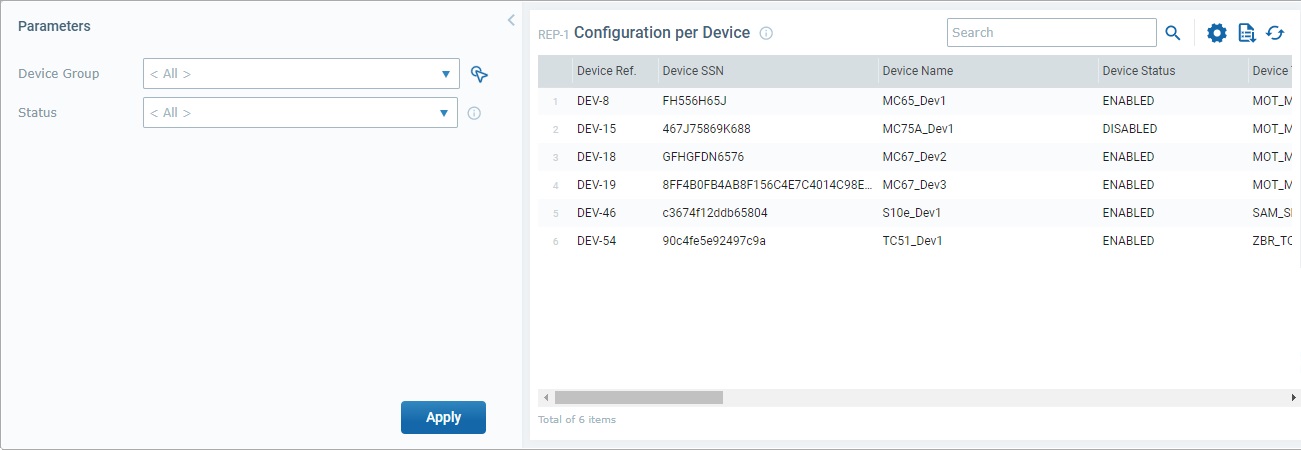
This section displays the parameters associated to the current report. Ex: This report includes 2 parameters "Device Group" and "Status" with defined values.
The parameter values, can be, temporarily, edited in this report view. Use the drop-down or the ![]() button (when available) to select another listed value.
button (when available) to select another listed value.
![]() This parameter edition is NOT permanent. It ONLY lasts while this page is open.
This parameter edition is NOT permanent. It ONLY lasts while this page is open.
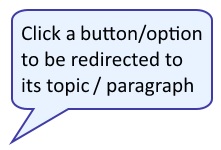
The content of this window is context-based. It opens when pressing the For instance, if this button is attached to the "Device Group" option, it will be named "Select a Device Group" and provide a list of device groups.
Example:
Potential Operations/Options:
The availability of these options depends on the context associated to this window.
•Use the search box to look for specific list items.
• Click
•
•
|