|
Counter Details |
  
|
Counter Details
|
Counter Details |
|
Overview
Counters are entities that aggregate metric information provided by MCL applications/devices paired with your MCL-Mobility Platform account.
Each counter can contain up to 20 metric values (= statistic results) which can be filtered/aggregated by time period and by key(s) - a primary and/or secondary key.
Counters can ONLY be created, edited or deleted at account level.
A site user (with the appropriate access rights) can access a counter's settings in the corresponding "Counter Details" page and use it to create dashboards/widgets, meaning, he can define a counter to be a data source for a dashboard's widget based on that information. See Dashboards.
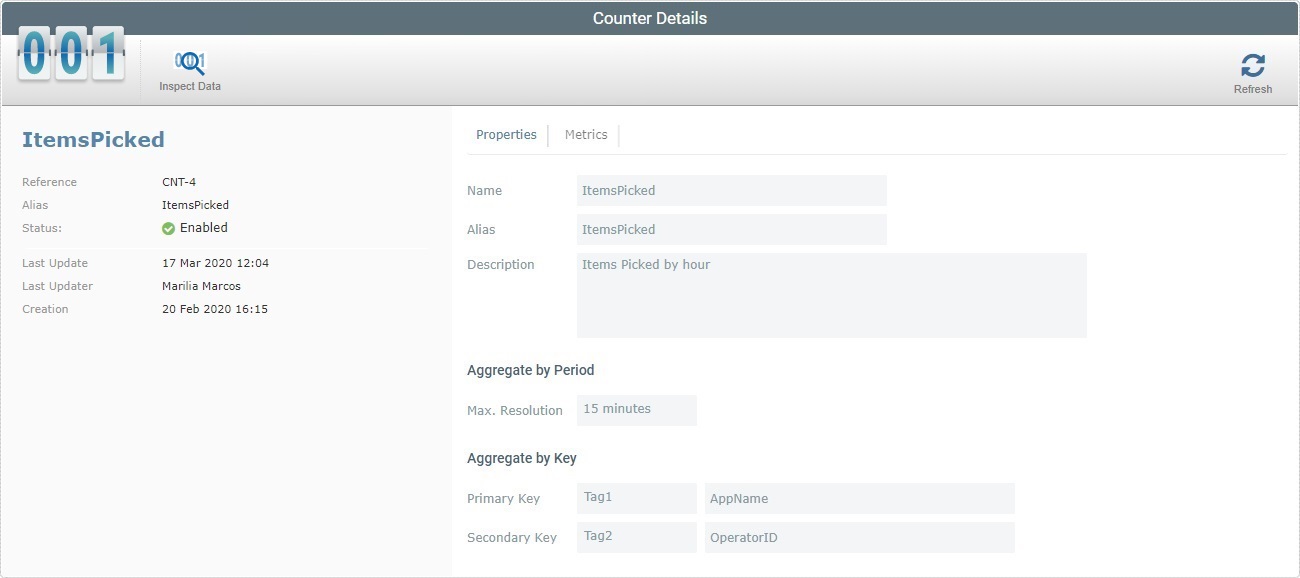
Details Page
Access: Admin Dashboard > Control Panel > Business Analytics module > Counters sub-module > Counter Management page > < click counter > > Counter Details page
Example of the details page of a counter:
Ref. column |
The internal reference for a metric. This reference is, automatically, attributed by the system and cannot be edited. |
Name* column |
The name of the metric. |
Alias column |
The metric's alias. |
Description column |
Information on the corresponding metric. |
<Name> |
Counter's name. |
<Status> |
Counter's current status. |
Name |
Counter's name. |
Alias |
Counter's alias. |
Aggregate by Period |
|
Max. Resolution |
The maximum time frame for the metric data aggregated by the counter, meaning, it refers to the time resolution that was defined for the counter to group the data it receives. |
Aggregate by Key |
|
Primary Key |
The counter's primary key for data aggregation/filtering. |
Secondary Key |
The counter's secondary key for data aggregation/filtering. |
Description |
|
<description> |
Relevant information about the counter. |
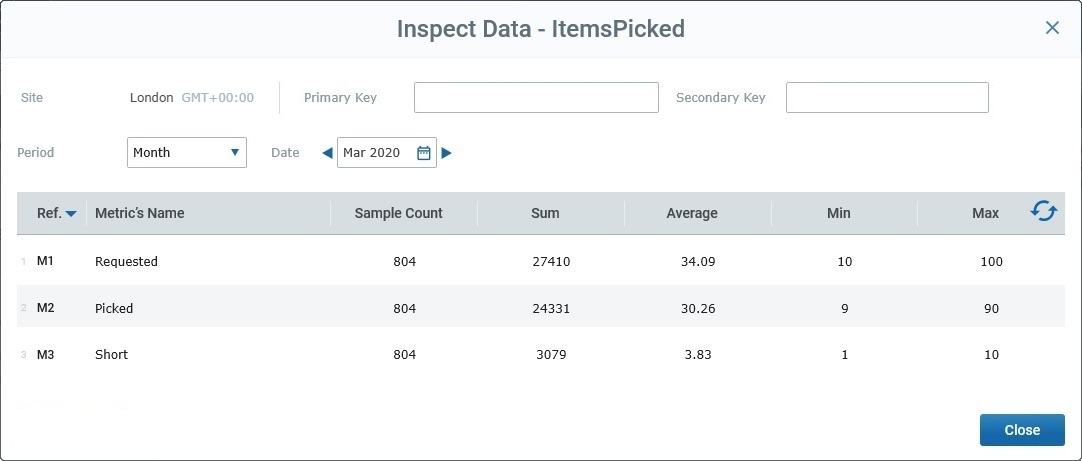
![]() Opens a pop-up window where you can check the aggregated metric data received by the current counter.
Opens a pop-up window where you can check the aggregated metric data received by the current counter.
•This window displays the current counter's aggregated metric data, specifically, the statistic results for each metric ("Sample Count"; "Sum"; "Average"; "Min" and "Max"). It only provides the metric information that was communicated to the current site.
•It is possible to filter the display according to the defined time frame (when the metrics were received). Use the following options to filter the displayed information:
Select the intended type of time frame from the drop-down (ex: "15 minutes", "Hour", "Day", "Week", "Month", etc.). The "Unlimited" time frame option deactivates the "Date" filter.
This filter adapts itself to the previously selected time frame. Define the time period. Use the See the examples below:
•If required, use a primary/secondary key to aggregate the displayed metric data further. For instance, if the counter is meant to receive a metric with operator information (ex: "Key 1: Operator ID"), you can enter an operator's ID code in one of the keys and the site/period filtered data will also be aggregated by operator.
•Use |