|
Dashboards |
  
|
Dashboards
|
Dashboards |
|
Overview
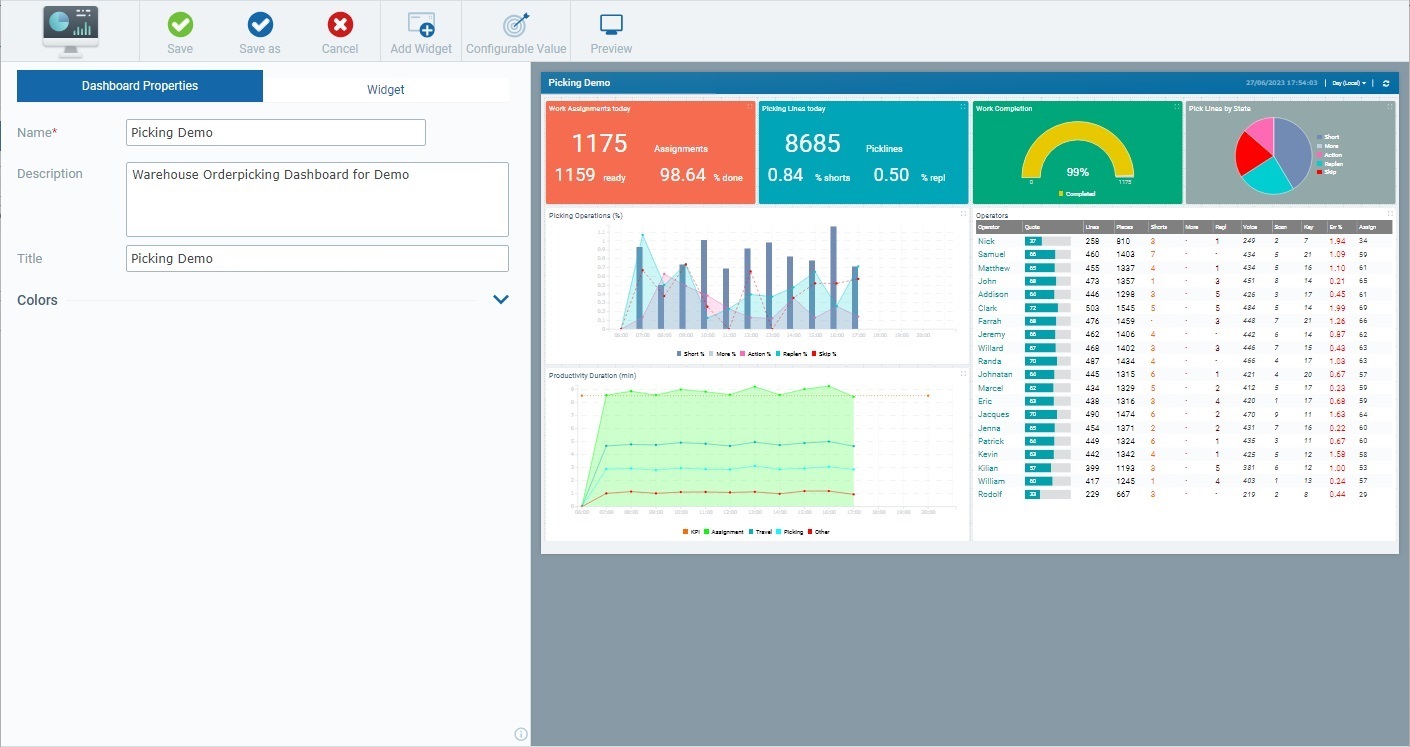
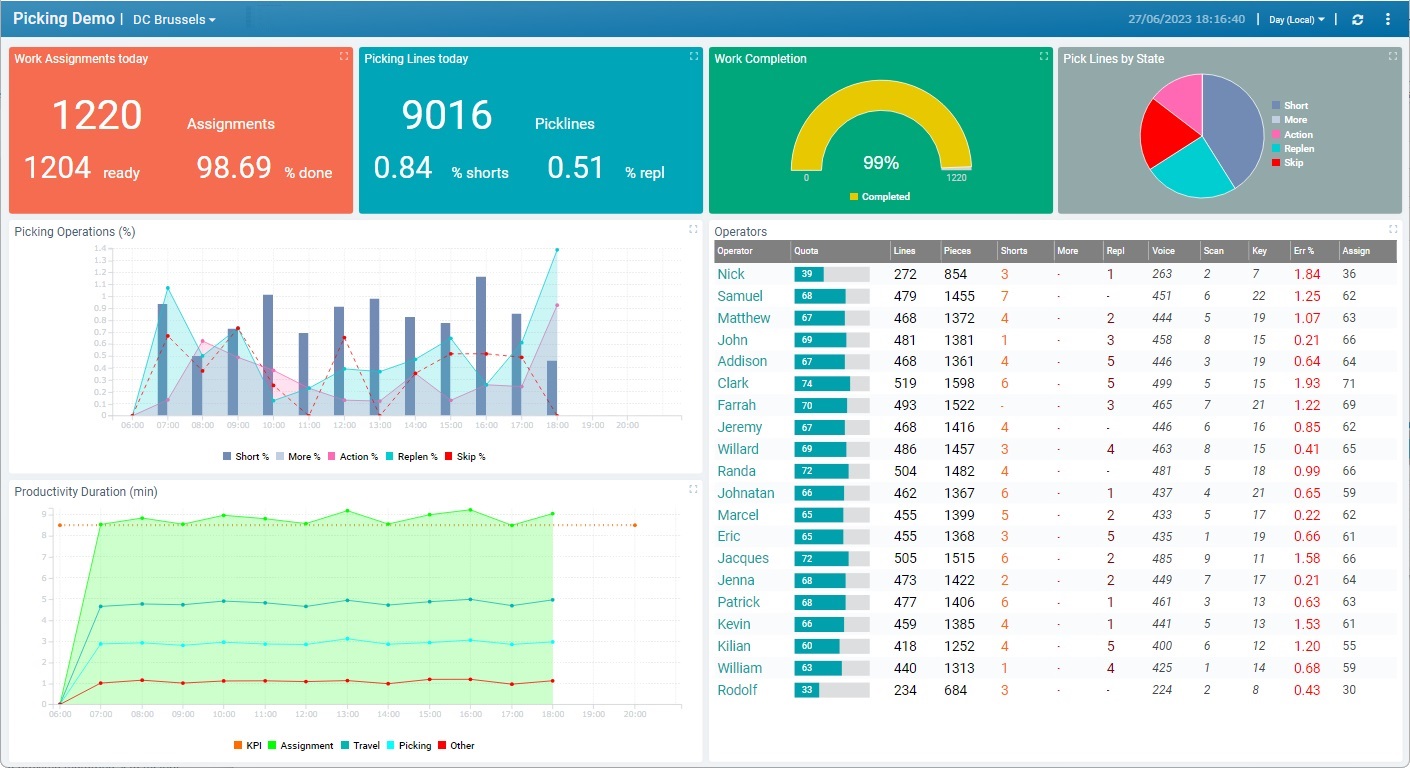
A dashboard is a graphical interface that allows you to display, track and analyze the metric information provided by the MCL application(s)/device(s).
Dashboards use metric information provided by the MCL application(s)/device(s) and expose it in widgets to meet specific needs - the selected widgets will provide and organize the information you want displayed.
You can combine multiple widgets into a single dashboard and adapt them to your screen size. See Widgets.
It is also possible to use information provided by the MCL-Mobility Platform account itself (ex: meta data concerning operator profile information), to define values that work as performance indicators (meaning, configurable values), to share a dashboard with other collaborators that do not have access to the MCL-Mobility Platform account (ex: for external presentations), etc.
See Basic Dashboard Operational Concepts below.
Basic Dashboard Operational Concepts
A value that is configured for a specific purpose, for instance, it can be used to measure the level of performance success/failure based on a given threshold/operational goal (similar to a KPI).
Ex: If you have a counter that provides the average number of picks executed in a specific warehouse, you can define a "configurable value" to set a specific number of picks as the goal for a predetermined time period (such as a shift) - the "configurable value", exposed in a dashboard, will be able to measure/indicate if the number of picks expected for that shift is about to be achieved or not.
You can define a "configurable value" as a widget's data source and/or have it as part of a formula you create and apply to a widget (using the "configurable value's" internal reference).
"Configurable Values" are associated to the dashboard they are created in, so they can ONLY be used within that dashboard, in any of the added widgets.
The "Configurable Values" of a dashboard can only be accessed in that dashboard's details page, when set to edit mode. See How to Create a "Configurable Value" below.
Step-by-step
1. Access the "Dashboard Management" page and select the dashboard that will contain the intended "configurable value" and be able to use it in its widgets.
2. In the selected dashboard's details page, set it to edit mode by clicking
3. Click the
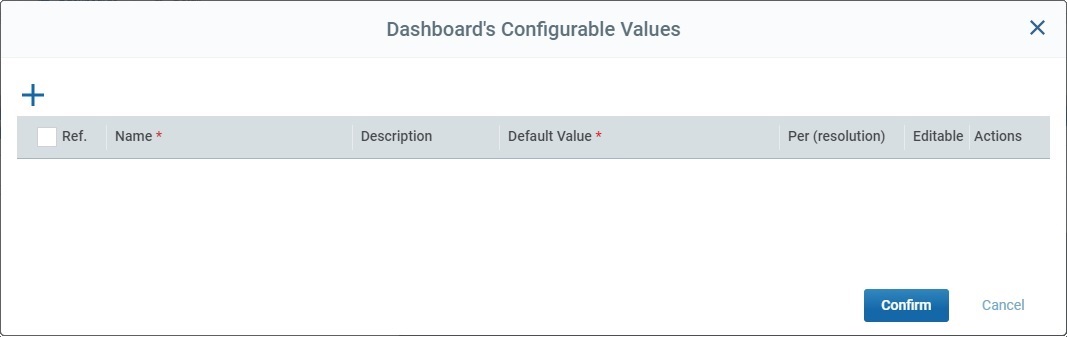
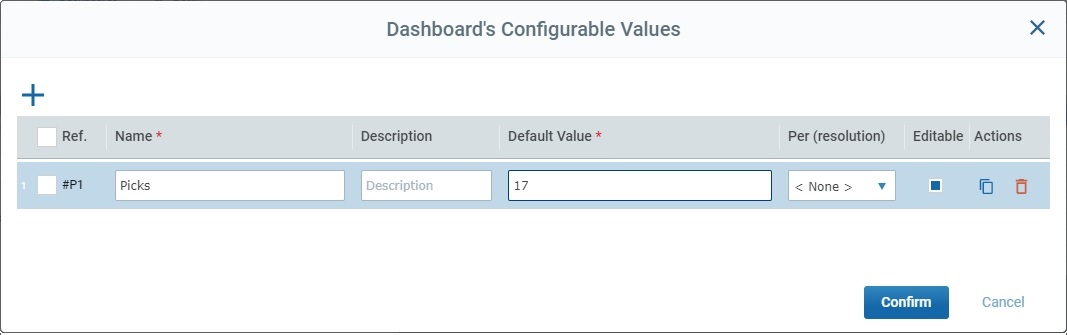
4. In the "Dashboard's Configurable Values" pop-up window, click
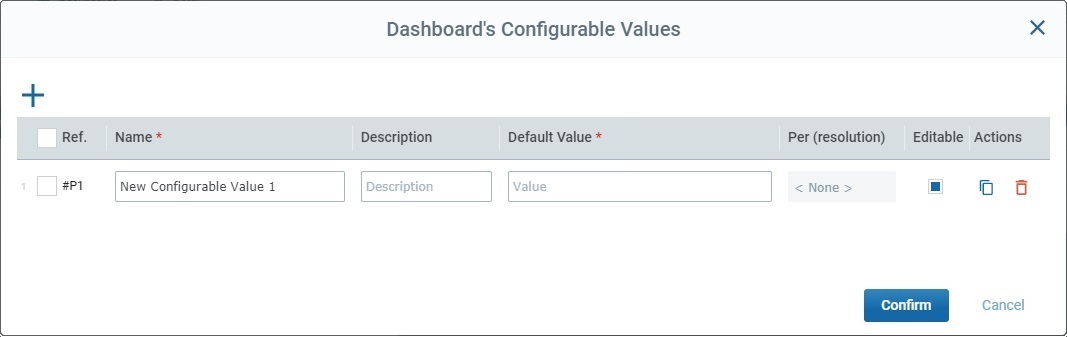
5. Fill in the available fields. The options marked with an asterisk MUST have information in the corresponding fields.
6. When you are done, click
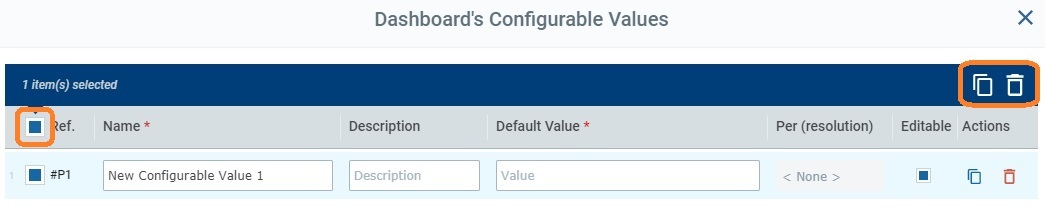
Whenever you want to check the available "configurable values" and their settings, set the dashboard's details page to edit mode and click
If you add/access a widget's settings and decide to define a "configurable value" as its data source but there is no "configurable value" available yet, you can open the "Dashboard's Configurable Values" pop-up window with the use of the
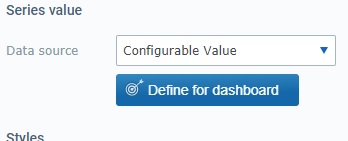
I. In a widget's "Data" tab ("Dashboard Management" page > intended dashboard's details page> "Widget" tab > "Data" tab), go to the "Series Value" section:
II. Click
III. Define one or more "configurable values" to be used in the currently open dashboard (see the step-by-step above, if you need help) and save your settings.
IV. The pop-up window closes and the "Series Value" section, now, provides all the options related to the "Configurable Value" data source, as expected.
|
•Dashboard in Live Mode
The Live Mode is the operational view of a dashboard, meaning, it displays the dashboard's widgets. It is meant to relay data, in real time, so that the authorized personnel can monitor/analyze the information. See Dashboard in "Live Mode".
The metric data that is sent by the MCL application(s)/device(s) to the MCL-Mobility Platform is processed in terms of statistic operations (sum, average; etc.) but also aggregated into specific period resolutions (hour; day; week, month).
You can set a specific period resolution for a dashboard, a widget and even a series within a widget (in a widget, values are represented as series - see Widget Series).
Having all these resolution levels implies the use of a resolution hierarchy - in this case, if the lowest entity has a set resolution, it will override the higher entity's resolution:
•The defining of a specific resolution for a widget's series means that the displayed value will NOT be affected by the resolution of any other element, meaning, the widget itself or the dashboard.
•If the widget has its own resolution, it will not refresh its value display/adopt the resolution you set in the dashboard that includes that widget.
It is possible to define "Auto" as a resolution for a series or a widget. This ensures that the lower entity refreshes its display according to the resolution set for the higher entity.
•A series with an "Auto" resolution will adapt its display to whatever resolution is set for the widget.
•A widget with an "Auto" resolution will adopt the resolution set in the dashboard, meaning, it will refresh the value display of the series with an "Auto" resolution.
However, if that widget includes series with a specific resolution, those series will NOT adapt their display.
![]()
To ensure that the value display of a widget is aggregated/grouped according to what you set in the dashboard, we recommend you define the widget and each of its series with an "Auto" resolution.
![]() If using a counter as a series' data source, remember that its values can also be aggregated into specific resolutions, which may affect value availability/display.
If using a counter as a series' data source, remember that its values can also be aggregated into specific resolutions, which may affect value availability/display.
See Counters.
•Widgets
Widgets are the visual component of a dashboard that display the required data. See Widgets.
The "Dashboards" Sub-Module
Dashboards are managed in the "Dashboards" sub-module which is included in the "Business Analytics" module.
You can view all available dashboards in the "Dashboard Management" page - it includes the dashboards that are created within the site and also the dashboards that are created at account level to be available to all the sites.
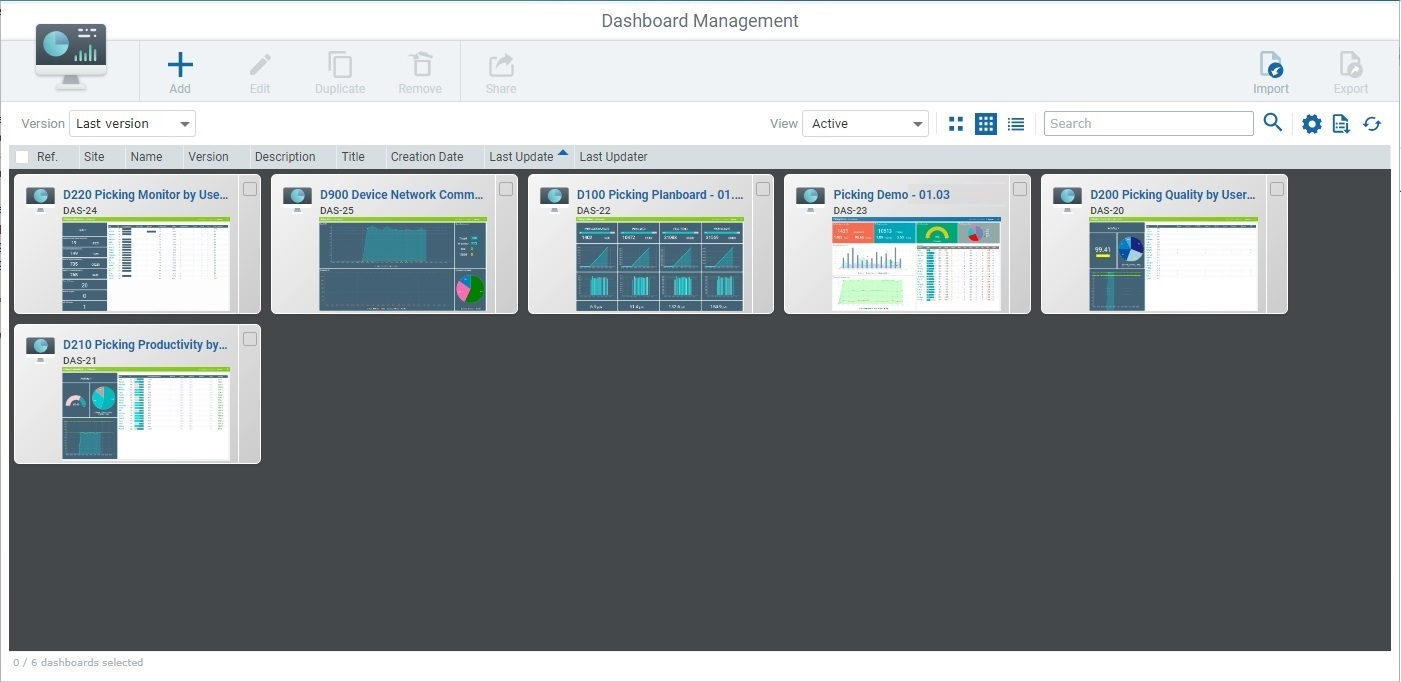
The "Dashboard Management" Page
To access the "Dashboard Management" page, click  (located in the "Control Panel) and, in the resulting row, select
 ![]() .
.
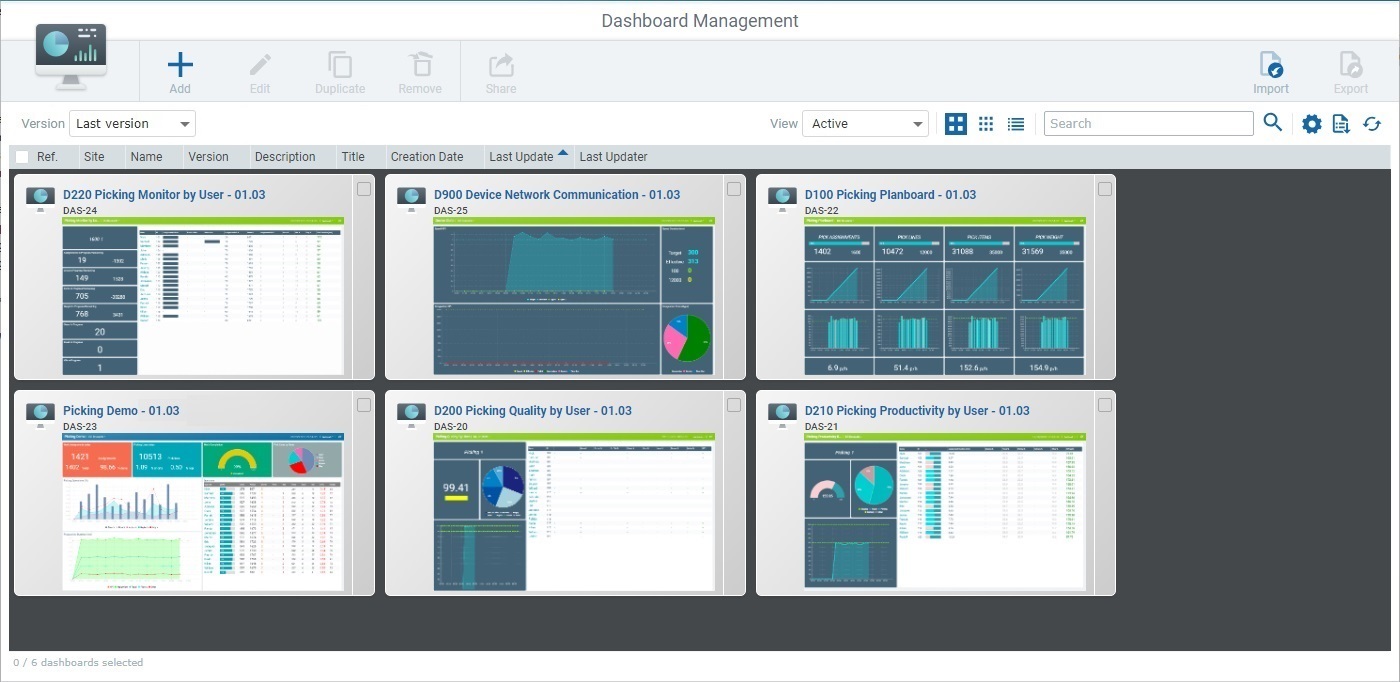
The "Dashboard Management" page displays dashboards created within the site and dashboards created at account level.
It also includes several dashboard related operations and information.
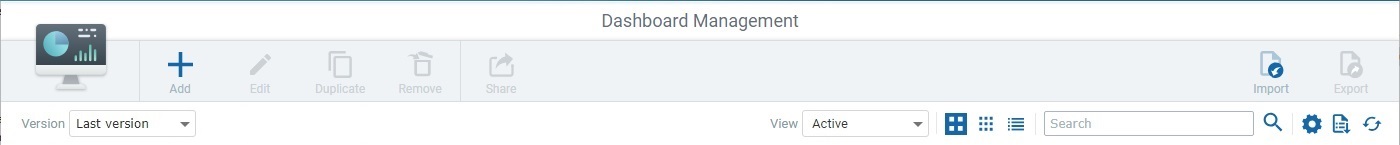
•Dashboards can be displayed in one of 2 types of grid (Big Grid, Small Grid) or as a list. Use the following buttons to define the view:
![]() Big Grid view.
Big Grid view.
![]() Small Grid view.
Small Grid view.
![]() List view.
List view.
▪Use ![]() to have the dashboard representations displayed big within a grid:
to have the dashboard representations displayed big within a grid:

▪Click ![]() to have the dashboard representations displayed smaller within the grid:
to have the dashboard representations displayed smaller within the grid:
Each box represents a dashboard - it includes the name and version of the dashboard and a widget view. If you click the dashboard's name, you open that dashboard in Live Mode.
If you want to access a dashboard's settings, check the intended dashboard's ![]() and, then, click
and, then, click ![]() (this button only becomes available when you select 1 dashboard).This opens the corresponding details page. See Dashboard Details.
(this button only becomes available when you select 1 dashboard).This opens the corresponding details page. See Dashboard Details.
▪Click ![]() to have the dashboards organized into a list:
to have the dashboards organized into a list:
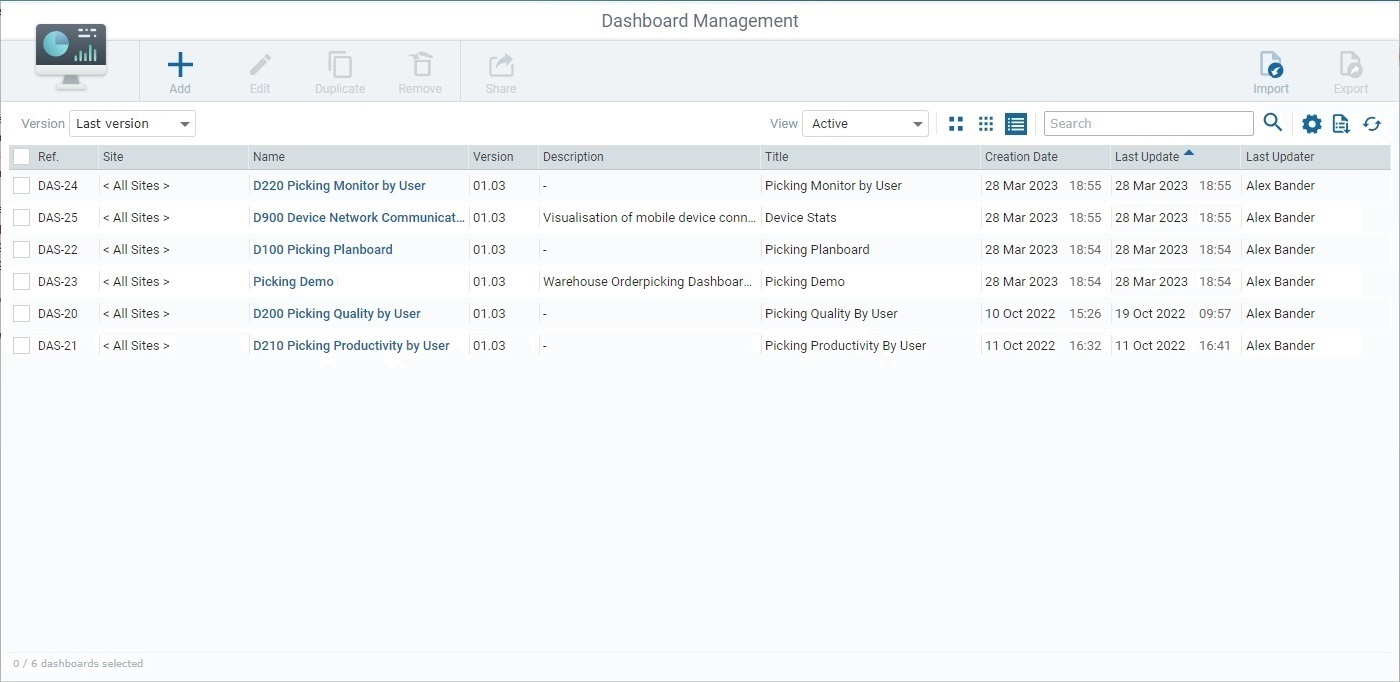
This view displays the following information:
Ref. |
Internal reference that identifies the dashboard. It is automatically generated when the dashboard is created and it cannot be changed. |
Site column |
The scope of the dashboard. It refers the site when the dashboard was created in the current site or "< All Sites>" when the dashboard was created at account level. |
Name column |
The dashboard's name - this identifies the dashboard within the account but it is NOT exposed in the dashboard itself. If you click it, the dashboard opens in Live Mode. See Dashboard in Live Mode. |
Version column |
The dashboard's version. |
Description column |
Information about the dashboard that was added in its details page. |
Title column |
The dashboard's title - this is the reference used in the dashboard itself. |
Creation Date column |
When the dashboard was created. |
Last Update column |
The date of the dashboard's last update. |
Last Updater column |
The name of the user that last updated the dashboard. |
![]() If some of these columns are NOT available, use the
If some of these columns are NOT available, use the ![]() button (upper right corner) to open a list with the available columns and check the ones you want to display.
button (upper right corner) to open a list with the available columns and check the ones you want to display.
![]() To access a dashboard's settings, check the intended dashboard's
To access a dashboard's settings, check the intended dashboard's ![]() and, then, click
and, then, click ![]() (this button only becomes available when you select 1 dashboard).This opens the corresponding details page. See Dashboard Details.
(this button only becomes available when you select 1 dashboard).This opens the corresponding details page. See Dashboard Details.
•If necessary, you can filter the listed dashboards with the use of the "Version" and/or "View" drop-downs.
![]() This drop-down is able to filter the dashboard display by only presenting the latest version of each dashboard. If you want to view all dashboard versions, select "<All>".
This drop-down is able to filter the dashboard display by only presenting the latest version of each dashboard. If you want to view all dashboard versions, select "<All>".
![]() This drop-down helps you filter the listed dashboards by view:
This drop-down helps you filter the listed dashboards by view:
▪"Active" - refers to all the enabled dashboards.
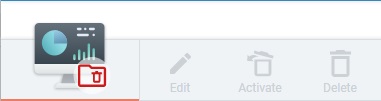
▪"Bin" - refers to the dashboards that have been moved to the bin/deactivated. When this view is selected, the "Dashboard Management" page's logo and the available header buttons change accordingly. See Available Operations.
•There is a search tool to look for specific dashboards:
![]()
a. Enter the name of the dashboard you are searching for.
b. Click ![]() or press <ENTER> in your PC keyboard to initiate the search.
or press <ENTER> in your PC keyboard to initiate the search.
c. Use one of the following to conclude the search operation:
▪empty the search box and click ![]() ;
;
▪empty the search box and press <ENTER> in your PC keyboard;
▪click the ![]() icon.
icon.
•Use ![]() to show/hide the columns of a List view. Proceed as follows:
to show/hide the columns of a List view. Proceed as follows:
a. Click ![]() (located on the upper right corner) to access the list of available columns/fields.
(located on the upper right corner) to access the list of available columns/fields.
b. Check the column(s) to be shown by clicking the corresponding ![]() .
.
c. Click ![]() to hide the list again.
to hide the list again.
•If required, use ![]() to export a "*.csv" file with a list of the displayed dashboards. The export only concerns the currently viewed/filtered dashboards and corresponding displayed columns/fields.
to export a "*.csv" file with a list of the displayed dashboards. The export only concerns the currently viewed/filtered dashboards and corresponding displayed columns/fields.
![]() Since the export ONLY includes the currently displayed information, make sure the page contains the intended dashboards before you begin the export. If required, use the search box and/or the available drop-downs ("Version", "View") to filter the display.
Since the export ONLY includes the currently displayed information, make sure the page contains the intended dashboards before you begin the export. If required, use the search box and/or the available drop-downs ("Version", "View") to filter the display.
•Click ![]() to manually refresh the page's information.
to manually refresh the page's information.
![]() The automatic refresh rate of the "Dashboard Management" page is 60 seconds.
The automatic refresh rate of the "Dashboard Management" page is 60 seconds.
•If necessary, you can sort the listed information:
![]()
Mouse over the desired column header to access the sorting arrow and organize/select the corresponding column's listed items:
▪![]() by ascending order.
by ascending order.
▪![]() by descending order.
by descending order.
•If you want to select all the listed items (in this case, all the dashboards) at once, click the column header's check box.
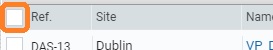
![]()
ONLY platform users with the corresponding user rights (account administrators, site managers, site supervisors and/or custom users with rights to view/manage the "Dashboard" module) can execute the operations mentioned below.
If a user, authorized to view the current module but without the necessary user rights, attempts to edit, duplicate, delete, export, etc. a dashboard, the resulting details page will open in view mode and CANNOT be set to edit mode. To check a user's rights, open the "User Access" tab of his details page. See Site User Details.
![]()
Most of the operations below do NOT apply to dashboards created at account level, ONLY to dashboards created within the current site. Dashboards created at account level are available to all the sites and MUST not be edited at site level because any account dashboard edition within a site would affect all the other sites that use the same dashboard.
To add a new dashboard, click ![]() and follow the steps described in Adding a Dashboard. This button is always visible/active, when the page is set to "Active" view.
and follow the steps described in Adding a Dashboard. This button is always visible/active, when the page is set to "Active" view.
To edit a dashboard, select the intended dashboard and click ![]() . This button is visible for both page views ("Active/"Bin") but it ONLY becomes active if ONE site dashboard (= dashboard created within the current site) is selected.
. This button is visible for both page views ("Active/"Bin") but it ONLY becomes active if ONE site dashboard (= dashboard created within the current site) is selected.
To duplicate the selected dashboard, click ![]() . See To Duplicate a Dashboard. This button is only visible when the page is set to "Active" view and it ONLY becomes active if ONE site dashboard (= dashboard created within the current site) is selected.
. See To Duplicate a Dashboard. This button is only visible when the page is set to "Active" view and it ONLY becomes active if ONE site dashboard (= dashboard created within the current site) is selected.
To move the selected dashboard(s) to the bin, use ![]() . See To Move a Dashboard To the Bin. This button is only visible when the page is set to "Active" view and it ONLY becomes active if one or more site dashboards (= dashboards created within the current site) are selected.
. See To Move a Dashboard To the Bin. This button is only visible when the page is set to "Active" view and it ONLY becomes active if one or more site dashboards (= dashboards created within the current site) are selected.
To share the selected dashboard, click ![]() and follow the steps described in To Share a Dashboard.
and follow the steps described in To Share a Dashboard.
This button is ONLY visible when the page is set to "Active" view and it ONLY becomes active if ONE dashboard is selected.
To import a dashboard from another account, click ![]() and proceed as described in To Import a Dashboard.
and proceed as described in To Import a Dashboard.
This button is ONLY visible/active, when the page is set to "Active" view.
To export a dashboard to other accounts, use the ![]() button. See To Export a Dashboard.
button. See To Export a Dashboard.
This button is visible for both page views ("Active/"Bin") but it ONLY becomes active if ONE dashboard is selected.
To activate a removed dashboard, use the ![]() option. This button is ONLY available when the page is set for "Bin" view and it ONLY becomes active if one or more dashboards are selected.
option. This button is ONLY available when the page is set for "Bin" view and it ONLY becomes active if one or more dashboards are selected.
Proceed as follows:
a. Set the "Dashboard Management" page to "Bin" mode.
b. Select the dashboard(s) you want to activate again. This enables the ![]() button.
button.
c. Click ![]() .
.
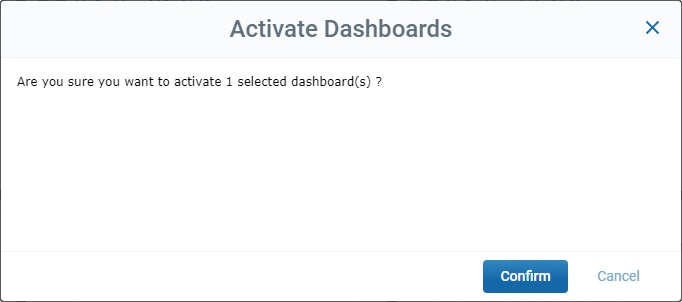
d. Click ![]() to confirm the operation and wait for the success message:
to confirm the operation and wait for the success message:
![]() .
.
e. Change the "Dashboard Management" page's view back to "Active" - the selected dashboard is available again.
To permanently delete a dashboard from the site, use the ![]() option. See To Delete a Dashboard from the Site.
option. See To Delete a Dashboard from the Site.
This option is ONLY available when the page is set for "Bin" view and it ONLY becomes active if one or more deactivated dashboards are selected.
This chapter includes all the aspects associated to dashboards (dashboard details, the creation and sharing of a dashboard, etc.).
Topic/Operation |
Description |
|---|---|
Information on what is displayed/available in a dashboard's details page. |
|
How to add a dashboard to the site and/or duplicate an existing site dashboard (= dashboard created within the current site). |
|
How to export a dashboard and import it onto another site. |
|
How to edit a site dashboard (= dashboard created within the current site). |
|
How to generate and share a link so other people can access a specific dashboard. |
|
Information on this operational display mode. |
|
How to remove a site dashboard (= dashboard created within the current site) from the "Dashboard Management" page and/or delete it from the site. |