|
Widgets |
  
|
Widgets
|
Widgets |
|
Overview
MCL-Mobility Platform provides several widgets that can be used in your dashboard(s) to display specific information. See Widget Data Sources.
The widgets available are:
•"Text" - Similar to a "Text Box", this widget can display static text values (the alphanumeric characters you write down OR it can display dynamic data (ex: data fed by a counter that is refreshed in real time). The defined value can be represented with alphanumeric characters or as a progress bar.
See Widget: Text.
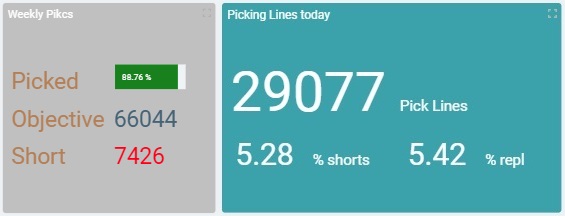
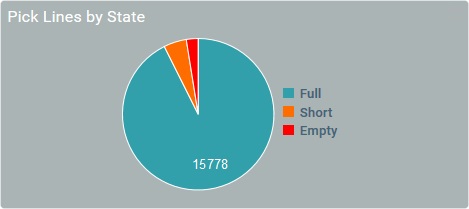
•"Pie Chart" - Displays static and/or dynamic data in a circular format divided into segments or "slices". Each segment represents specific data (= a series). This type of representation is very useful for visual comparison/analysis.
See Widget: Pie Chart.
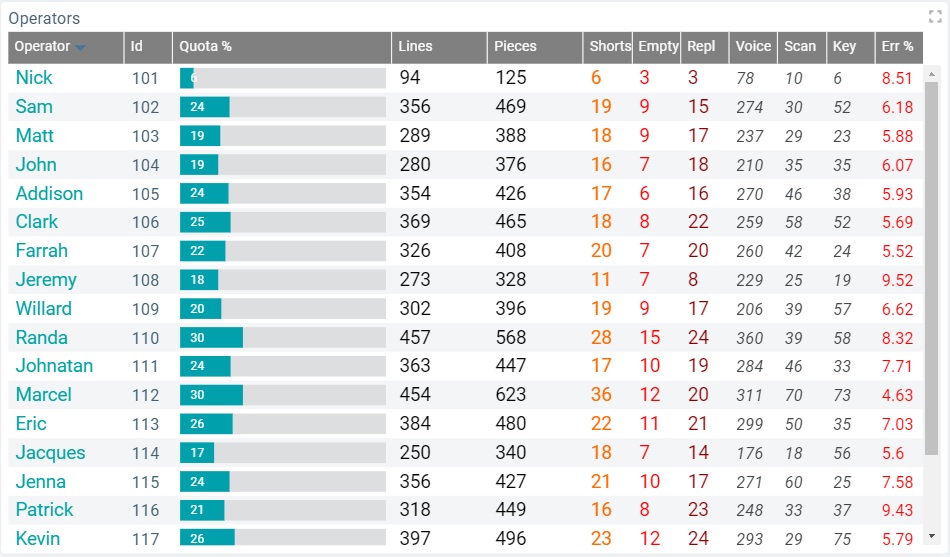
•"Data Table" - In addition to the static/dynamic data sources available for the other widgets, the "Data Table" can also display master data provided by the MCL-Mobility Platform account (ex: operator profile information such as operator name, login ID, language, etc.).
For instance, the data table widget can show how many items were picked by a specific operator and what type of input he used for the picking - the Master Data provides operator identity (ex: "operator name") and the intended counters can provide metric information (ex: number of picks, speech/keyboard/scanner inputs) that is aggregated by operator.
The information is organized into a table. Each column represents a series.
See Widget: Data Table.
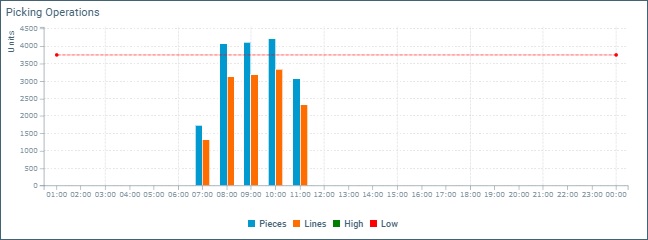
•"Time Chart" - Is used to show the intended values and their progression within a specific time frame. The intended static and/or dynamic values can be represented as a line, a bar, a point or an area. It is possible to use more than one type of representation, simultaneously, in the same widget.
See Widget: Time Chart.
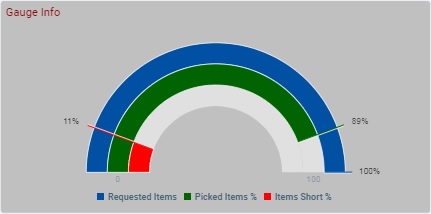
•"Gauge" - Is used to display static and/or dynamic values in a rainbow shaped bar that is segmented - each segment represents a series.
See Widget: Gauge.
In a widget, a value/set of values is referenced by a series. Depending on the chosen widget, a series can be represented as a "slice", a line, a column, etc.
You can have up to 20 series in each widget.
It is possible to customize each series in terms of style (ex: text color, bar or line format); data source (see Widget Data Sources), time resolution (ex: "Day (UTC)", "Day (Local", "Month"), etc. The available options depend on the type of widget you select.
The default name suggestion for each series is "My Series <incremented number>" (ex: "My Series 1", then, "My Series 2", and so on) but we recommend defining a name that relates to the value it refers to.
The corresponding internal reference for each series is "#S <number>" (ex: "#S1") - it is attributed by the system and CANNOT be edited. It can be used, for instance, in formulas, when you want to identify a series. Ex: A formula defined in a series with a "Static/Formula" data source - "=#S1-100" (the value represented in series "#S1" minus 100). The series will display the result of the subtraction.
The data source of a series is defined in the widget's "Data" tab ("Series Value" section).
You can use the same data source type for all the series or define a different type for each series.
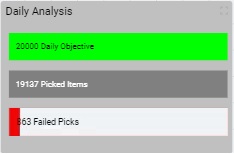
Ex: This widget uses 3 data source types, one per series:
Text Widget |
||
Series Ref/Name |
Data Source |
Result |
#S3 Daily Objective |
Configurable Value: "#P1 Picks" |
|
#S1 Picked Items |
Counter: "#C1 ItemsPicked" Metric: "M2 Picked" |
|
#S2 Failed Picks |
Static/Formula: "=#P1 - #S1" Result : 863 |
|
MCL-Mobility Platform allows for 4 types of data source for its widgets - "Counters", "Static/Formula", "Master Data" and "Configurable Values".
Data Source: Configurable Value
The available data sources depend on the type of widget being used. For instance, a "Pie Chart" does NOT have "Master Data" as a data source but the "Data Table" has all 4 data sources available.
The data source is defined at series level, meaning, you do not define a data source for the whole widget, you select a data source for each widget series (widget series = a set of data. See Widget Series).
This data source type relies on the counters from your MCL-Mobility Platform account (created in the "Counters" sub-module). See Counters.
A counter can include several metrics and it is the statistic operations based on those metrics that you will associate to a series.
Metrics
Specific operator/application related data that is sent by the MCL application/device to the MCL-Mobility Platform.
When MCL-Mobility Platform receives metric data, it aggregates that information into specific time periods ("Hour", "Day (UTC)", "Day (Local)", "Week (Day (UTC))", "Week (Day (Local))" and "Month") and processes it using predefined statistic operations:
•Sum: refers to the sum of the received values during a specified time frame ("Hour", "Day (UTC)", "Day (Local)", "Week (Day (UTC))", "Week (Day (Local))" or "Month").
•Sample Count: is the number of received values during a specific period ("Hour", "Day (UTC)", "Day (Local)", "Week (Day (UTC))", "Week (Day (Local))" or "Month").
•Average: refers to the average of the values received during a specified time frame ("Hour", "Day (UTC)", "Day (Local)", "Week (Day (UTC))", "Week (Day (Local))" or "Month").
•Min.: is the lowest value received during a specified time frame ("Hour", "Day (UTC)", "Day (Local)", "Week (Day (UTC))", "Week (Day (Local))" or "Month").
•Max.: is the highest value received during a specified time frame ("Hour", "Day (UTC)", "Day (Local)", "Week (Day (UTC))", "Week (Day (Local))" or "Month").
Each counter has an internal reference, "#C <incremented number> ", which is, automatically, attributed when you create a counter and it is NOT editable.
The counter's metrics also have an internal reference to identify them ("M <incremented number> "). This reference is also, automatically, generated and non-editable.
These internal references are used to identify the corresponding counter/metric if, for instance, you want to reference them in a formula (ex: in a formula you have entered in a widget's series with a "Static/Formula" data source - see Data Source: Static Formula below).
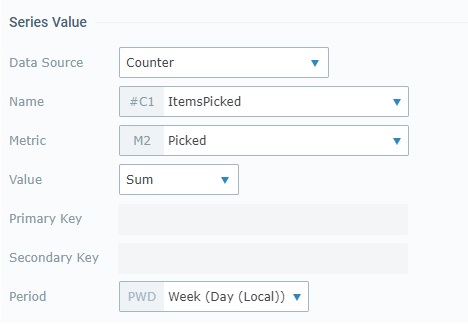
The data source for a widget’s series is managed in a dashboard’s details page, specifically, in the “Data” tab (dashboard’s details page > “Widget” tab > “Data” tab). In this case, the “Data” tab presents the following "Counter" data source related options:
When you access the details page of a dashboard that was created at account level, you will be able to view the widget's settings but you will NOT be able to edit them. In this case, you will NOT be able to edit or change the data source.
|
|||||||||||||||
This data source refers to values/formulas you provide and will be represented by the selected series.
You can use "static" values (ex: "=30") that will be represented as such in the defined series but also formulas (ex: "=3*10"), in which case, the series will reference the result of the entered formula and NOT the formula itself.
Ex: Having the formula "=1000-50" means the series will reference its result - "950".
Ex: If you enter "= 30", the series will represent the value "30".
A formula can include numbers but also, refer a counter, a configurable value, a series or a metric.
Accepted Syntax
•ALWAYS start with a "=" sign, regardless of using a value or a formula.
•It ONLY accepts numeric values.
•Basic mathematical operations are accepted (addition, subtraction, multiplication, etc.).
•You must use the internal references of counters ("#C <number>"), configurable values (#P <number>), series ("#S <number>") and/or metrics ("#M <number>") to refer them in a formula.
Examples
=#S1 / 2 = (the value represented in series "#S1" is divided by half and the result is displayed in the series with this formula.)
=#S1 + #S2 = (The series with this formula will display the sum of the values referenced by series "#S1" and "#S2".)
=Math.max (#S1,#S2)= (the series with this formula will display the largest value that was found between the values represented by series "#S1" and "#S2".)
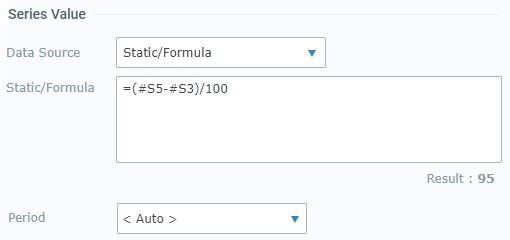
The data source for a widget’s series is managed in a dashboard’s details page, specifically, in the “Data” tab (dashboard’s details page > “Widget” tab > “Data” tab). In this case, the “Data” tab presents the following "Static/Formula" data source related option:
When you access the details page of a dashboard that was created at account level, you will be able to view the widget's settings but you will NOT be able to edit them. In this case, you will NOT be able to edit or change the data source.
|
||||||||
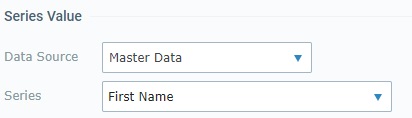
Master Data is a specific type of information that is always provided by the MCL-Mobility Platform. It relates to the Operator List information contained in your MCL-Mobility Platform account (ex: the operator's Login ID, first name, short name, gender, language, etc.).
This type of data source is ONLY available for the "Data Table" widget.
Having Master Data as a data source of a widget series implies that the MCL-Mobility Platform account MUST have sites with operator profiles - this data is aggregated by operator related master data entities such as "operator name", "spoken name", "last name" etc. If there are no operator profiles, these entities do not exist.
Check the operator profile to view the available fields that will result in metric information. See Operator Details.
This data source is ONLY available for Data Table widgets. Master Data refers to specific operator related data that is provided by the MCL-Mobility Platform (ex: operator name, ID, when the operator logs in/logs out etc.).
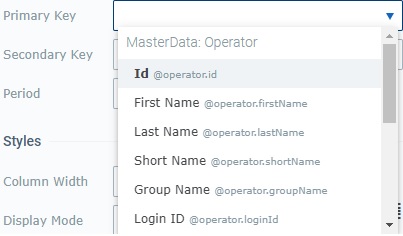
The data source for a widget’s series is managed in a dashboard’s details page, specifically, in the “Data” tab (dashboard’s details page > “Widget” tab > “Data” tab). In this case, the “Data” tab presents the following "Master Data" data source related options:
When you access the details page of a dashboard that was created at account level, you will be able to view the widget's settings but you will NOT be able to edit them. In this case, you will NOT be able to edit or change the data source.
|
||||||
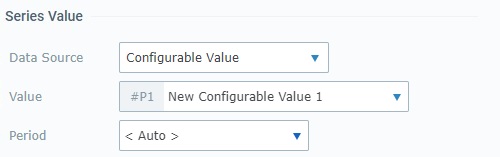
Data Source: Configurable Value
A value that is configured for a specific purpose, as a sort of KPI (Key Performance Indicator). For instance, it can be used to help measure the level of performance success/failure based on a given threshold/operational goal.
After creating a "configurable value" and associating it to a widget, its value can be redefined in the dashboard when it is in "Live Mode". See Dashboard in Live Mode.
Each "configurable value" has its own internal reference to identify it ("#P<number>") which is, automatically, generated when you define one and it is NOT editable.
This internal reference is used to identify the corresponding value - you can use it to reference the intended "configurable value" in a formula (for instance, in a formula you have entered in a widget's series with a "Static/Formula" data source - see Data Source: Static Formula).
"Configurable Values" are associated to the dashboard they are created in, so they can ONLY be used and edited within that dashboard, in any of the added widgets.
To be able to use "Configurable Values", you must, first, create them. See Details on How to Create a "Configurable Value.
The data source for a widget’s series is managed in a dashboard’s details page, specifically, in the “Data” tab (dashboard’s details page > “Widget” tab > “Data” tab). In this case, the “Data” tab presents the following "Configurable Value" data source related options:
The "Value" and "Period" options are ONLY available if there are already configured values for the current dashboard. If there are none, the "Value" and "Period" options are replaced with a This window lists the existing "configurable values" and also allows you to add the necessary values and/or edit them.
As an alternative, access the "Dashboard's Configurable Values" pop-up window by clicking the
When you access the details page of a dashboard that was created at account level, you will be able to view the widget's settings but you will NOT be able to edit them. In this case, you will NOT be able to edit or change the data source.
|
||||||||
If you want to access a widget's properties:
1. Open the "Dashboards" sub-module (it is included in the "Business Analytics" module);
2. Check the ![]() of the dashboard that contains the widget you want to access;
of the dashboard that contains the widget you want to access;
3. Click ![]() . The corresponding dashboard details page opens;
. The corresponding dashboard details page opens;
4. Select the intended widget from the dashboard's Preview Section (to the right);
5. In the "Widget" tab, navigate its child tabs ("Properties" and "Data") to access all the widget's settings.