|
Site Dashboard |
  
|
Site Dashboard
|
Site Dashboard |
|
Overview
The Site Dashboard can be accessed by the Account Administrator and the Site Manager but it is, mostly, the Site Manager's working area, meaning, where he manages applications, operator profiles, deployments, etc. of the site he is assigned to.
The following image displays the initial view of a Site, when accessed by the Site Manager. It consists of a header, a footer and the Site Dashboard which includes several sections dedicated to a site's administrative and operational tasks.
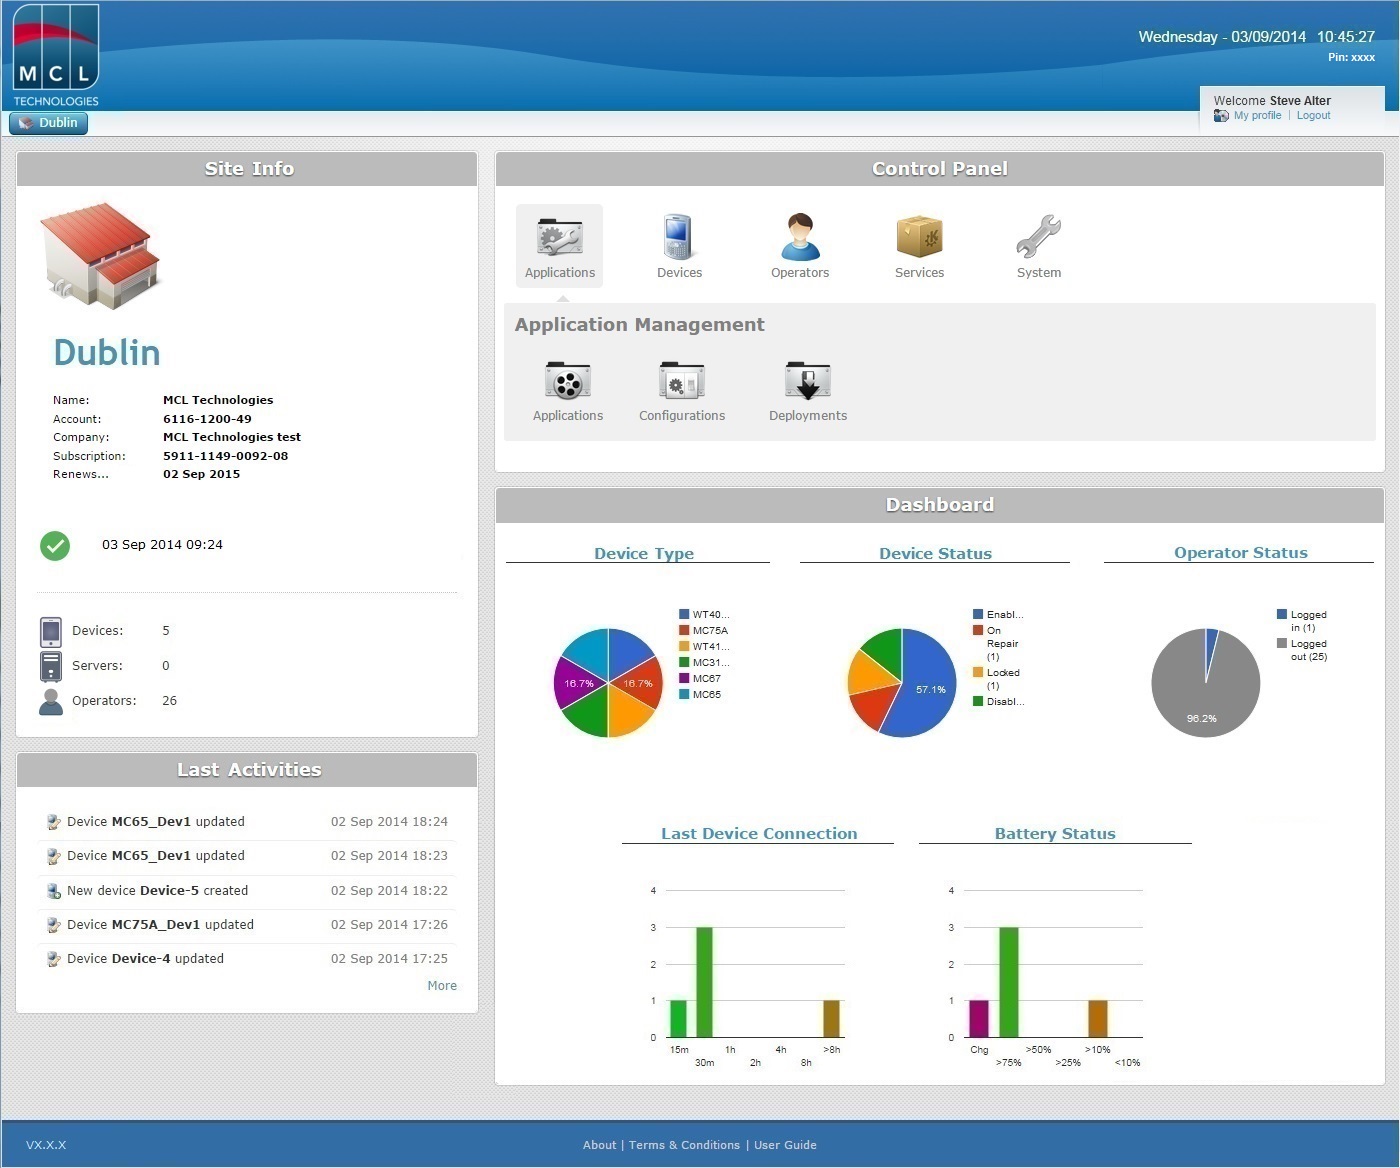
![]() The Site User can also have access to the Site Dashboard and all its sections/information. The only exception is the "System" module (within the "Control Panel" section) which includes the "Site Users", "Files" and "Site Details" sub-modules. Depending on the site user's access rights, he will have access, or not, to the remaining modules: "Applications", "Devices", "Operators" and "Services".
The Site User can also have access to the Site Dashboard and all its sections/information. The only exception is the "System" module (within the "Control Panel" section) which includes the "Site Users", "Files" and "Site Details" sub-modules. Depending on the site user's access rights, he will have access, or not, to the remaining modules: "Applications", "Devices", "Operators" and "Services".
Header
The header displays information regarding the account and the site itself:
•The company's logo (optional).
•The name of the site as a breadcrumb.
•The current date of site access.
•The current time in the site's location.
•The current default Pin Code to be used within the App Desktop environment (to access locked options) and to open a remote control session (see To Open a Remote Control Session). This Pin Code information does NOT apply if you have a customized Pin Code.
•A "Welcome Box" where you can log out and view/edit personal details in your profile (see Managing your Profile).
Site Dashboard
The Site Dashboard is the site manager's work area, meaning, where he manages applications, operators, devices, site details, etc.. If required, the Site Manager may create site user profiles with access to the Site Dashboard. The viewing of the Site Dashboard sections will differ according to the site user's access rights (the exception being the "System" section which is NOT available to site users).
The Site Dashboard consists of four main sections - Site Info; Last Activities; Dashboard and Control Panel.
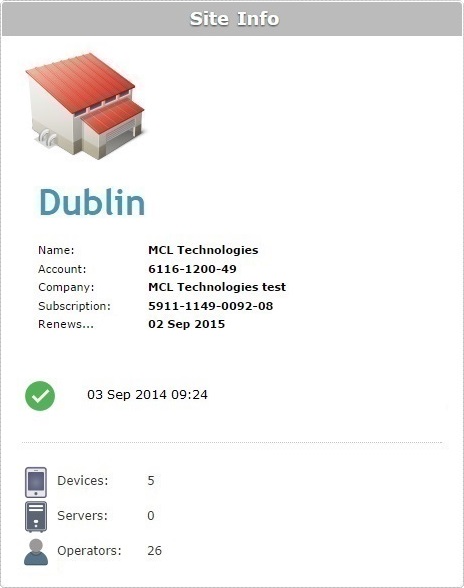
Site Info
Located on the upper left corner, this section displays information concerning the site and the account it is included in.
It is not possible to edit any of its elements.
The indicators below display the account and company names, the account identification number, the subscription's identification number, the subscription's expiration date, the subscription's status and date/time of the last connection to MCL-Subscription Manager and the consolidations of the subscription's limits regarding devices, servers and operators.
|
The status and date/time of the last connection to MCL-Subscription Manager: The The Error Message Example: |
|
Refers to the devices that are currently enabled within the site. |
|
Refers to the MCL-Net servers that are currently enabled within the site. |
|
Refers to the operators currently enabled within the site. |
Last Activities
This section, located at the lower left corner, displays the last activities performed in the site.
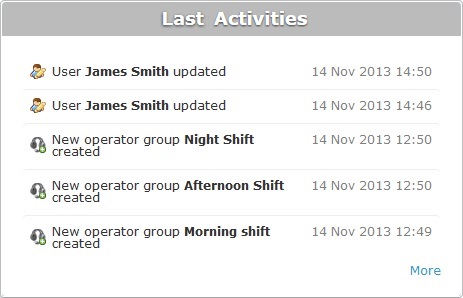
The tasks displayed in the "Last Activities" section include the adding, updating and deleting of:
•users
•servers
•applications, configurations and deployments
•devices and device groups
•operators and operator groups
You can view several details regarding these activities:
•The action itself.
•The date and time they occurred.
If you click ![]() , you open a window with the last 100 activities performed inside the account and who performed them.
, you open a window with the last 100 activities performed inside the account and who performed them.
To navigate, use the ![]() buttons.
buttons.
To close the window, click ![]() .
.
Control Panel
Located on the upper right corner of the Site Dashboard, this section includes the operational modules that allow for the actual management of a site. Depending on predefined access rights, the content of the Control Panel is either totally (only the Site Manager and the Account Administrator have full access) or partially available. Each module represents a functional site component:
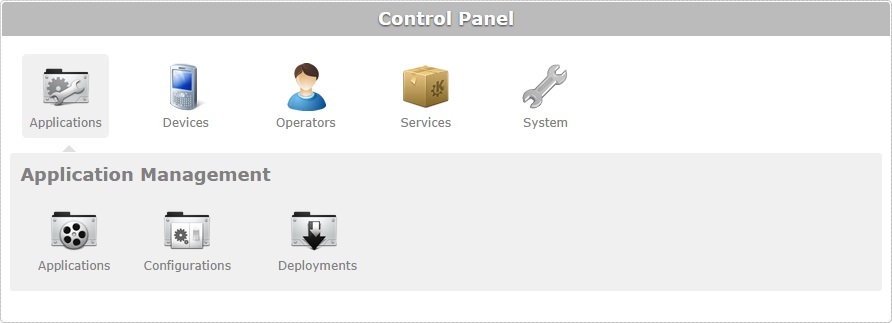
Applications
This module includes all aspects regarding application management. It provides access to the Applications, Configurations and Deployments sub-modules.
To display the row with the corresponding sub-modules, click ![]() .
.
For more detailed information on each sub-module, see Applications, Configurations, Deployments.
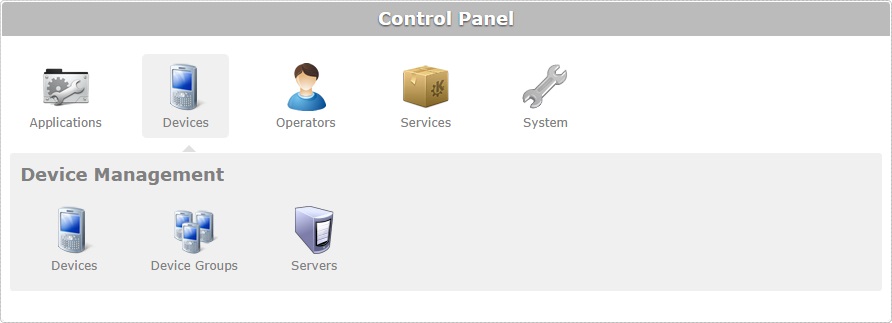
Devices
This module focuses on managing the device pool (device distribution/internal organization into groups, device status, server usage, etc.). These aspects are grouped into three sub-modules: Devices, Device Groups and Servers.
To display the row with the corresponding sub-modules, click ![]() .
.
For more detailed information on each sub-module, see Devices, Device Groups, Servers.
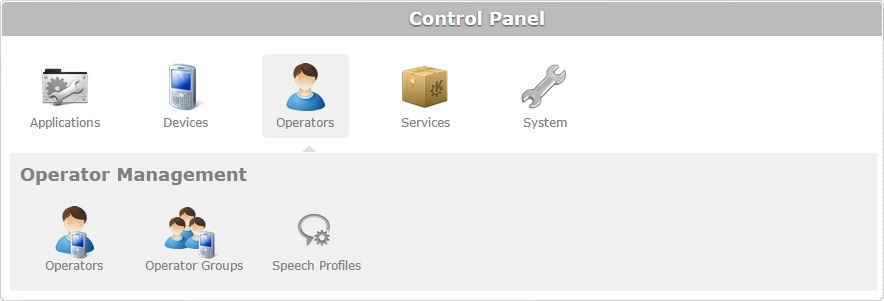
Operators
This module includes everything related to operators (the people who handle the devices), meaning, identification, organization into groups.
The Operators module provides access to two sub-modules: Operators and Operator Groups.
If the site is associated to a subscription with speech services and those services are managed locally, this module will also provide access to the Speech Profiles sub-module which handles all speech related aspects.
To display the row with the corresponding sub-modules, click ![]() .
.
For more detailed information on each sub-module, see Operators, Operator Groups; Speech Profiles.
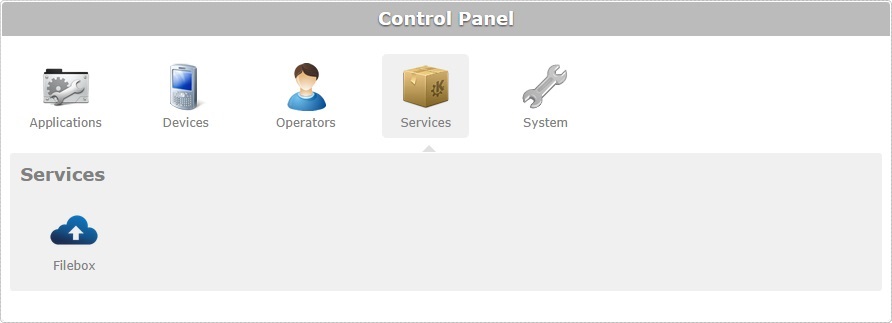
Services
This module relates to site services. It includes the MCL provided service, Filebox (a virtual storage and forwarding space for files).
To display the row with the corresponding sub-module, click ![]() .
.
For more detailed information on this sub-module, see Filebox.
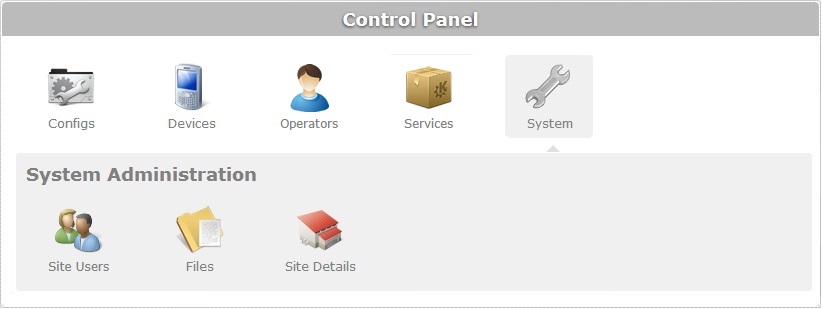
System
This section handles the administrative aspects that have to do with users, files and sites. This module is only available to the Site Manager and the Account Administrator.
To display the row with the corresponding sub-modules, click ![]() .
.
For more detailed information on each sub-module, see Site Users, Files, Site Details.
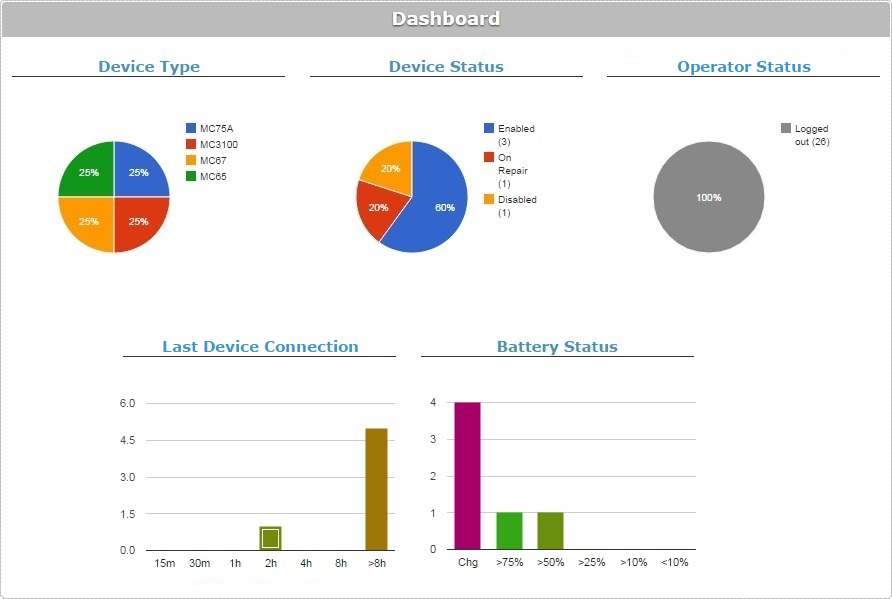
Dashboard
This section is located on the lower right corner of the Site Dashboard. It displays pie and column charts with information about the site's device pool and operators. If you mouse over a section of the pie chart or a column, you get the corresponding information.
•Device Type chart (includes all the device models in the site's device list, regardless of current status)
•Device Status chart (presents the statuses associated to all the devices included in the current site)
•Operator Status chart (only includes "enabled" operators. Displays how many operators are logged in and out)
•Last Device Connection chart (refers the time that has passed since your device(s) last contacted the platform. (Ex: The green column informs you that 1 device last contacted the platform about 2 hours ago).
•Battery Status chart (refers to the power status of all devices associated to the current site).
Footer
The footer includes the following:
•The current MCL-Mobility Platform version (to the left).
•The "About" button (in the middle) - when clicked, provides Copyright information.
•The "Terms & Conditions" button (in the middle) - when clicked, displays the corresponding document concerning the use of MCL-Mobility Platform.
•The "User Guide" button (in the middle) - when clicked, displays the MCL-Mobility Platform User Guide.