|
Counter Details |
  
|
Counter Details
|
Counter Details |
|
Overview
Counters are entities that aggregate metric information provided by MCL applications/devices paired with your MCL-Mobility Platform account.
Each counter can contain up to 20 metric values (= statistic results) which can be filtered/aggregated by time period and by key(s) - a primary and/or secondary key.
Counters can have an "Enabled" (default) or "Disabled" status. See Changing a Counter's Status.
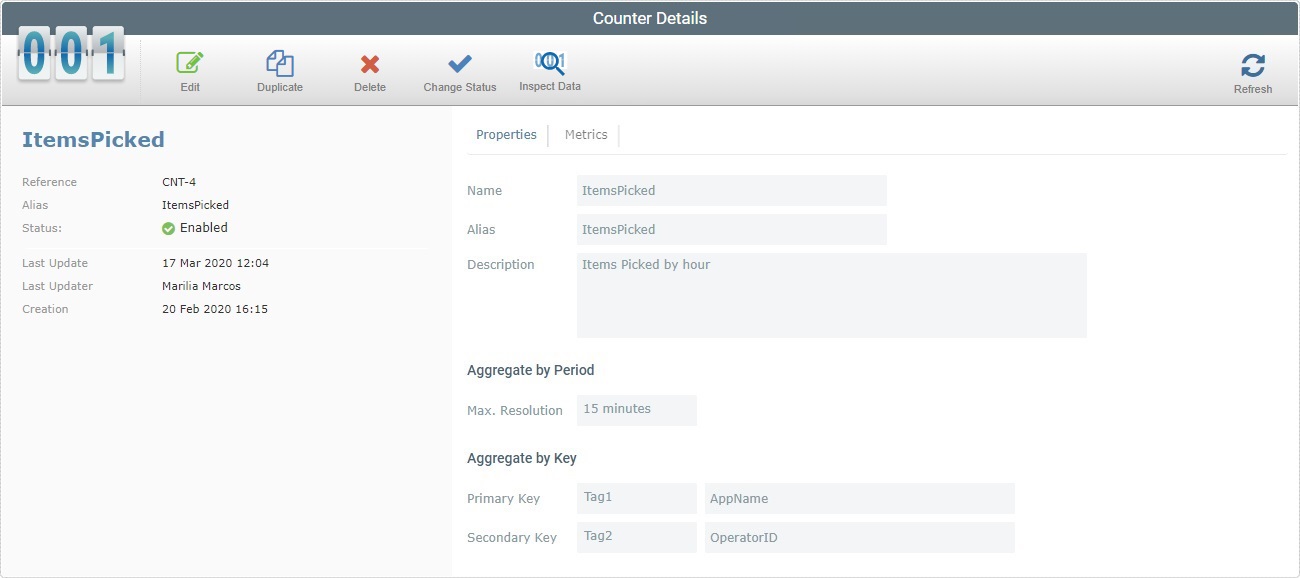
Details Page
Access: Admin Dashboard > Control Panel > Business Analytics module > Counters sub-module > Counter Management page > < click counter > >Counter Details page
Example of the details page of a counter:
Ref. column |
The internal reference for a metric. This reference is, automatically, attributed by the system and cannot be edited. |
Name* column |
The name of the metric. |
Alias column |
The metric's alias. |
Description column |
Information, added by the platform user, on the corresponding metric. |
<Name> |
Counter's name. |
<Status> |
Counter's current status. |
Name |
Counter's name. |
Alias |
Counter's alias. |
Aggregate by Period |
|
Max. Resolution |
The maximum time frame for the metric data you want the counter to aggregate, meaning, it refers the time resolution that was defined for the counter to group the data it receives. |
Aggregate by Key |
|
Primary Key |
The counter's primary key for data aggregation/filtering. |
Secondary Key |
The counter's secondary key for data aggregation/filtering. |
Description |
|
<description> |
Relevant information, entered by the platform user, about the counter. |
![]() Sets the current details page to edit mode. See Editing a Counter.
Sets the current details page to edit mode. See Editing a Counter.
![]() Duplicates the current counter. See Duplicating a Counter.
Duplicates the current counter. See Duplicating a Counter.
![]() Deletes this counter. See Deleting a Counter.
Deletes this counter. See Deleting a Counter.
![]() Changes the current status of this counter. See Changing a Counter's Status.
Changes the current status of this counter. See Changing a Counter's Status.
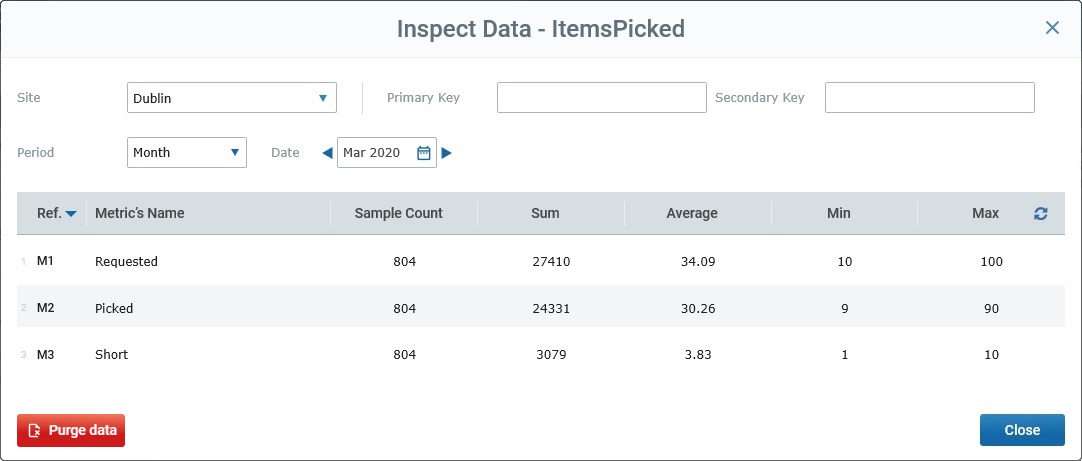
![]() Opens a pop-up window where you can check the aggregated metric data received by the current counter.
Opens a pop-up window where you can check the aggregated metric data received by the current counter.
•This window displays aggregated metric data, specifically, the statistic results for each metric ("Sample Count"; "Sum"; "Average"; "Min" and "Max").
•The data's display can be filtered according to source site (the site that provides the required metrics) and time frame (when the required metrics were received).
•If required, use a primary/secondary key to aggregate the displayed metric data further. For instance, if the counter is meant to receive a metric with operator information (ex: "Key 1: Operator ID"), you can enter an operator's ID code in one of the keys and the site/period filtered data will also be aggregated by operator.
•Click
•If required, purge the aggregated metric data in the defined time frame (= the currently displayed data) with the |